Auditing Process. Audit Planning Process

 Block Diagrams
Block Diagrams solution with the pre-made templates, samples and stencil libraries full of vector elements can be used for drawing any needed Block diagram, Functional block diagram, or Block flow diagram. Using the created block diagrams for visualizing the high-levelled concepts of engineering, software system design and business, any business owner has a chance to succeed in doing what he is meant to. Many business specialists, business owners, and project managers will find the ConceptDraw DIAGRAM block diagram creator with Block Diagrams solution useful for drawing the 2D and 3D Block diagrams as using the pre-designed objects.
Definition Flowchart

Professional Diagram and Flowchart Software

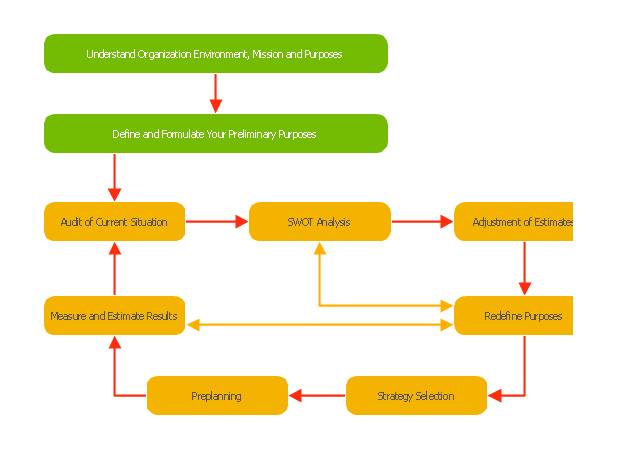
"Planning (also called forethought) is the process of thinking about and organizing the activities required to achieve a desired goal.
Planning involves the creation and maintenance of a plan. As such, planning is a fundamental property of intelligent behavior. This thought process is essential to the creation and refinement of a plan, or integration of it with other plans; that is, it combines forecasting of developments with the preparation of scenarios of how to react to them.
An important, albeit often ignored aspect of planning, is the relationship it holds with forecasting. Forecasting can be described as predicting what the future will look like, whereas planning predicts what the future should look like. The counterpart to planning is spontaneous order." [Planning. Wikipedia]
The block diagram example "Planning process" was created using the ConceptDraw PRO diagramming and vector drawing software extended with the Block Diagrams solution from the area "What is a Diagram" of ConceptDraw Solution Park.
Block diagram
Examples of Flowcharts, Org Charts and More


Understanding the Audit Process: A Comprehensive Guide. Audit Process Flowchart

Flow Chart Template

Business Productivity - Management

TQM Diagram Example

7 Management & Planning Tools

HelpDesk
Event-driven Process Chain (EPC) Diagram Software
 Diagram Software *")
Contoh Flowchart

Process Flow Chart Software Free

Horizontal Cross Functional Flowchart

Visual Presentations Made Easy with Diagramming Software


Decision Making


Risk Analysis

What is an Organizational Chart and how it works?Organization Chart Software

Process Flow Chart

- Event-driven Process Chain (EPC) Diagrams | Think. Act ...
- Sales Flowcharts | Data Flow Diagrams (DFD) | Small Hotel ...
- Example of Organizational Chart | Local area network (LAN ...
- Block diagram - Planning process | Project planning process ...
- Block diagram - Planning process | Auditing Process . Audit Planning ...
- Successful Strategic Plan | Example of Organizational Chart
- Process Flowchart | Organisational Planning Process With Diagram
- Block diagram - Planning process | Seven Management and ...
- Auditing Process . Audit Planning Process - Flowchart | Block diagram
- HR Flowcharts | HR management process - Flowchart | Electronic ...