Definition Flowchart
“A flowchart is a type of diagram that represents an algorithm, workflow or process, showing the steps as boxes of various kinds, and their order by connecting them with arrows. This diagrammatic representation illustrates a solution model to a given problem. Flowcharts are used in analyzing, designing, documenting or managing a process or program in various fields.” [Wikipedia]
This definition flowchart gives a clear answer for the question "What is a flowchart?". It is convenient to use a powerful ConceptDraw DIAGRAM software extended with Flowcharts Solution from the "Diagrams" Area of ConceptDraw Solution Park to design flowcharts of various types which will additionally illustrate a definition flowchart.
According to the definition flowchart, the flowcharts consist from the simple geometric symbols and arrows which define relationships. Flowcharts Solution offers you two libraries with large set of already predesigned flowchart symbols and arrows. You need only drag the desired of them from the libraries to document and connect as necessary.
For example, if we talking about programming, you will need an oval symbol to represent beginning and end of a program, a rectangle symbol for representing process, a diamond symbol for decision, a parallelogram for I/O process, and a cloud for Internet.
Example 1. Definition Flowchart. Design Elements. Planning Process Flowchart for Apple OS X and Windows
The flowchart sample you see on this example was created in ConceptDraw DIAGRAM software using the tools of Flowcharts Solution and shows the planning process. It is included in Flowcharts Solution and available from ConceptDraw STORE.
Use the definition flowchart and predesigned objects from the libraries of Flowcharts Solution for ConceptDraw Solution Park to design professional looking Flowcharts and flowchart definition samples fast, easy, effective.
All source documents are vector graphic documents. They are available for reviewing, modifying, or converting to a variety of formats (PDF file, MS PowerPoint, MS Visio, and many other graphic formats) from the ConceptDraw STORE. The Flowcharts Solution is available for all ConceptDraw DIAGRAM or later users.
See also Samples:
TEN RELATED HOW TO's:
Chart Audits, Chart Auditor - Designing the chart auditor can use the audit flowchart symbols from the Audit Flowcharts library for Audit Flowcharts Solution. Moreover it is convenient to use anyone of samples or templates offered by Audit Flowcharts Solution and design its own chart audits and audit flowcharts on the base of them.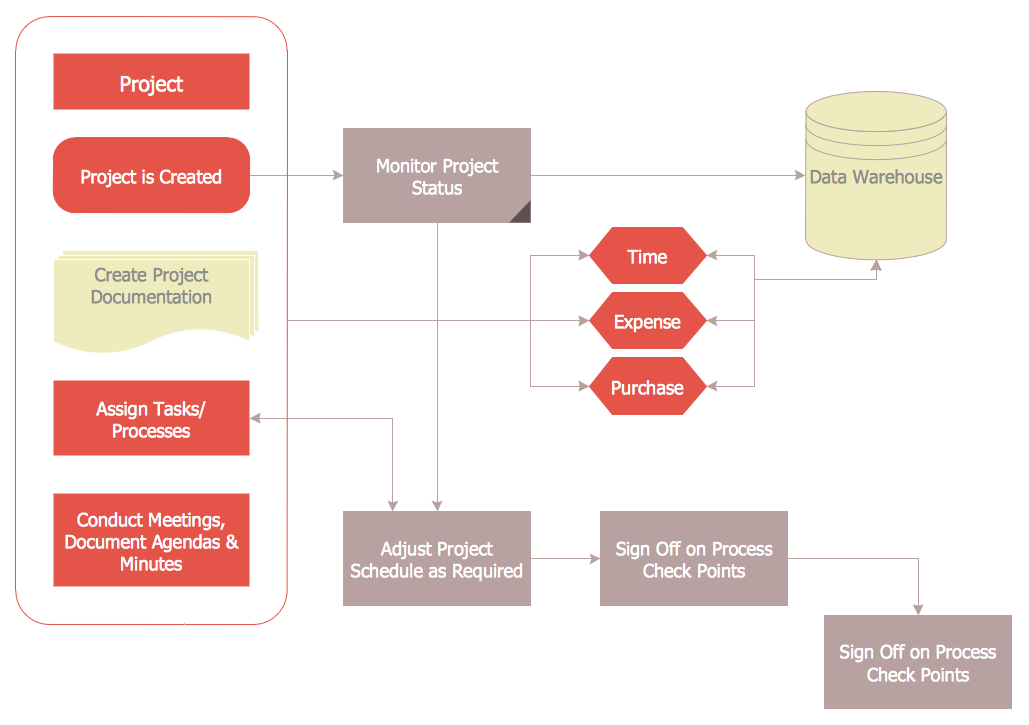
Picture: Chart Audits. Chart Auditor
Related Solution:
While creating flowcharts and process flow diagrams, you should use special objects to define different statements, so anyone aware of flowcharts can get your scheme right. There is a short and an extended list of basic flowchart symbols and their meaning. Basic flowchart symbols include terminator objects, rectangles for describing steps of a process, diamonds representing appearing conditions and questions and parallelograms to show incoming data.
This diagram gives a general review of the standard symbols that are used when creating flowcharts and process flow diagrams. The practice of using a set of standard flowchart symbols was admitted in order to make flowcharts and other process flow diagrams created by any person properly understandable by other people. The flowchart symbols depict different kinds of actions and phases in a process. The sequence of the actions, and the relationships between them are shown by special lines and arrows. There are a large number of flowchart symbols. Which of them can be used in the particular diagram depends on its type. For instance, some symbols used in data flow diagrams usually are not used in the process flowcharts. Business process system use exactly these flowchart symbols.
Picture: Flowchart Symbols: Meaning and Examples
Related Solution:
ConceptDraw DIAGRAM is a Mac OS X and Windows software. Numerous vector stencils, samples and templates created by designers are included in the basic package. This is classic flowchart maker which exactly follows the industry standards using flowchart symbols geathered during a ten years into solution park.
Picture: Flowchart Software
Related Solution:
Use the set of special professionally developed swim lane flowchart symbols - single, multiple, vertical and horizontal lanes from the Swimlanes and Swimlanes BPMN 1.2 libraries from the Business Process Diagram solution, the Swim Lanes library from the Business Process Mapping solution as the perfect basis for your Swim Lane Flowcharts of processes, algorithms and procedures.
Picture: Swim Lane Flowchart Symbols
Related Solution:
The Circular Arrows Diagrams are very popular in management and marketing. They are the useful way to visualize a sequence of steps, tasks, or events as a circular flow. But how design the Circular Arrows Diagram quick and easy? You will need a powerful software. ConceptDraw DIAGRAM charting and vector drawing software is exactly what you need. Extended with a multi-functional Business Diagrams solution from the Management Area, ConceptDraw DIAGRAM is the best for drawing the Circular Arrows Diagrams.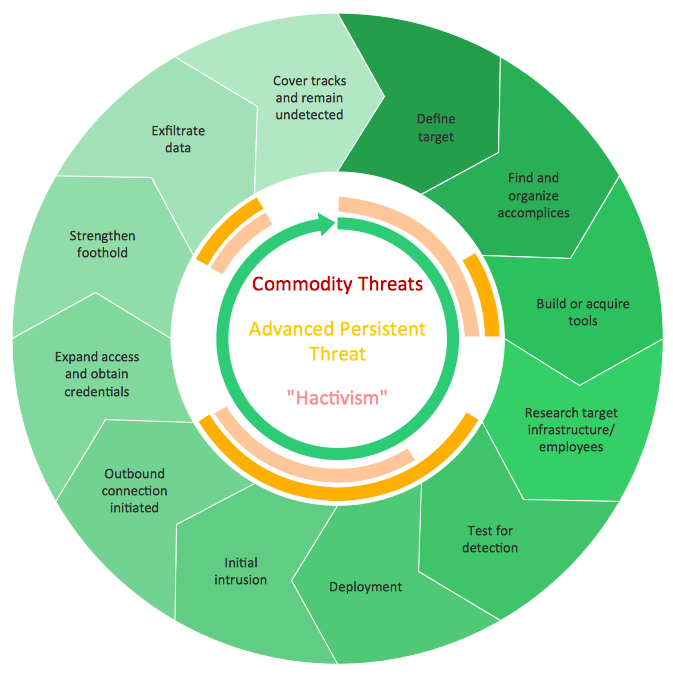
Picture: Circular Arrows
Related Solution:
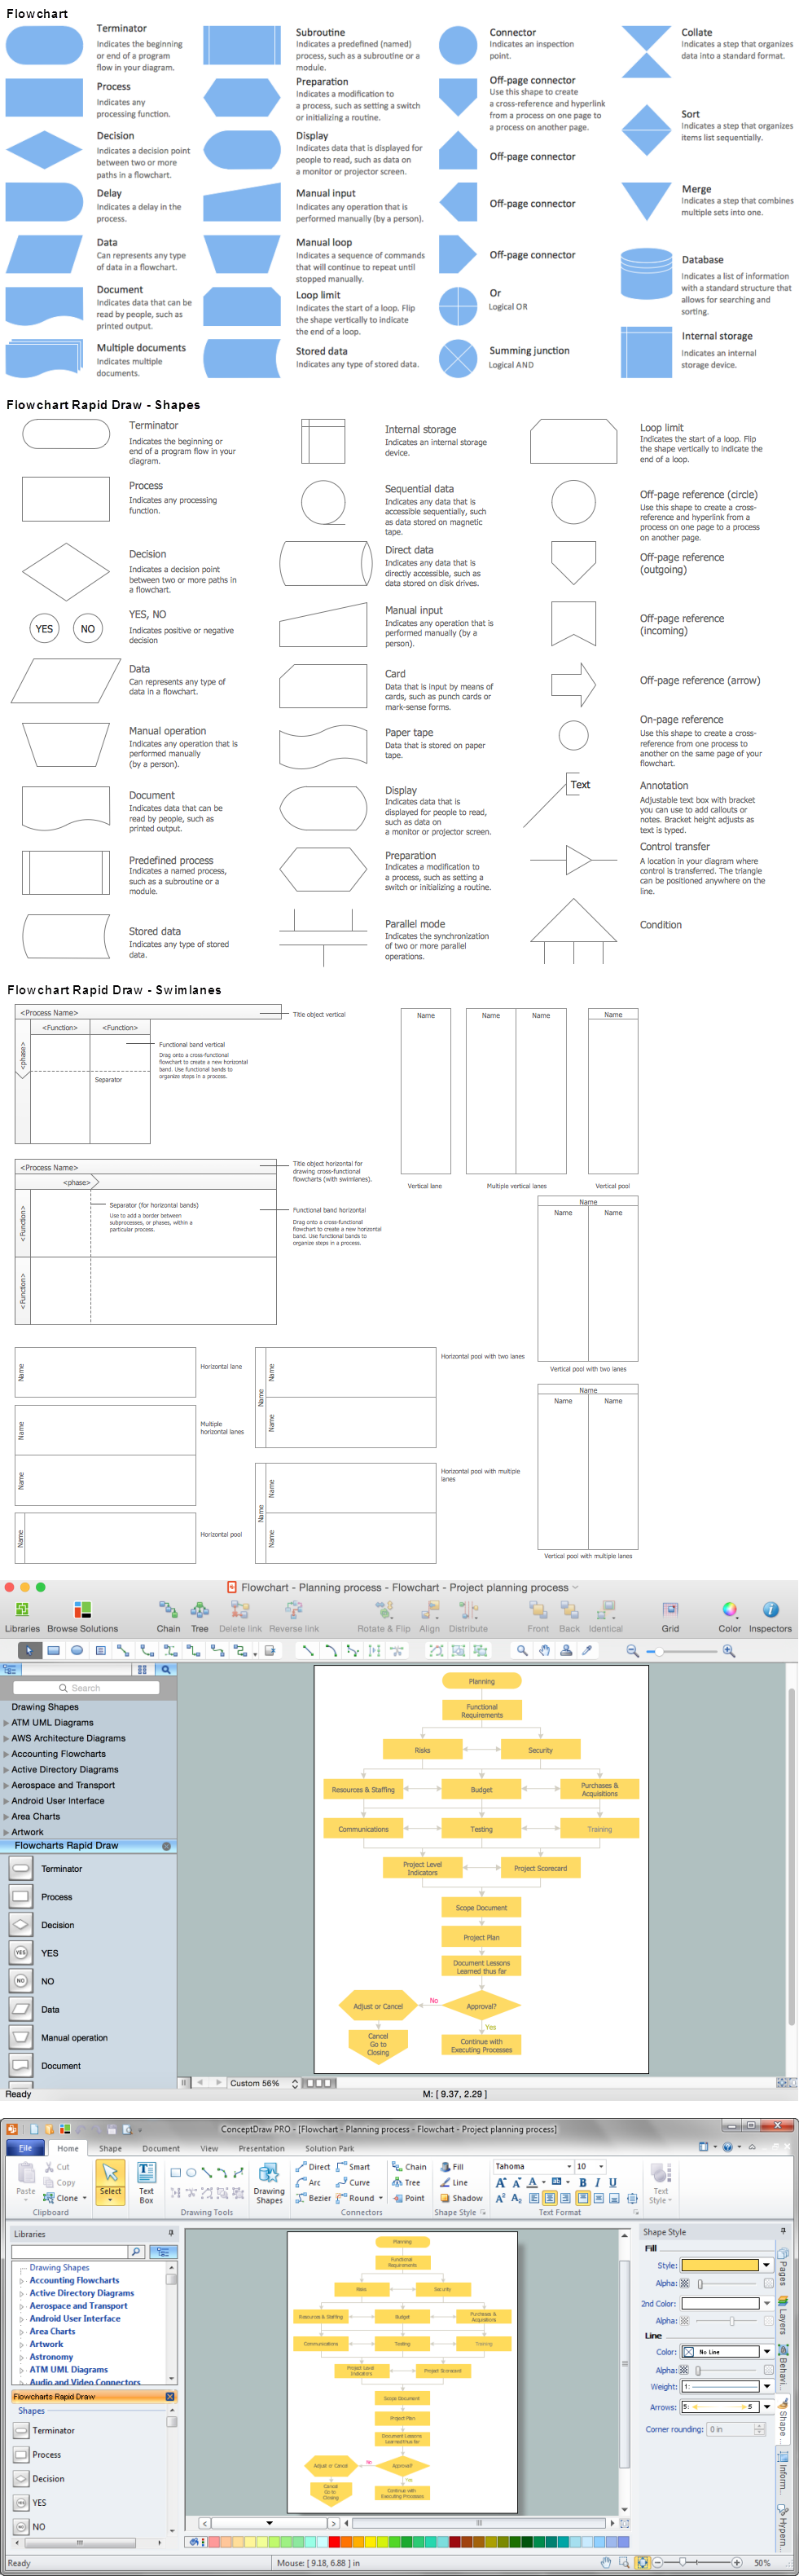
This sample was created in ConceptDraw DIAGRAM drawing software using the Flowcharts solution.
Picture: Horizontal Flowchart
Related Solution:
Create professional business process diagrams using ConceptDraw Data library with 10 objects from BPMN.
Picture: Business Process Elements: Data
Internal auditing is an independent, objective assurance and consulting activity designed to add value and improve an organization's operations.
ConceptDraw DIAGRAM diagramming and vector drawing software extended with Audit Flowcharts solution from the Finance and Accounting area perfectly suits for the Internal Audit Process. You can make sure this right now!
Picture: Internal Audit Process
Related Solution:
Event-Driven Process chain Diagrams for improvement throughout an organisation. Best software for Process Flow Diagram. The Event-driven Process Chain (EPC) Diagrams allows managers to plan processes and resources.
Picture: Business process Flow Chart — Event-Driven Process chain (EPC) diagrams
Related Solution:
The Total Quality Management Diagram solution helps your organization visualize business and industrial processes. Create Total Quality Management diagrams for business process with ConceptDraw software.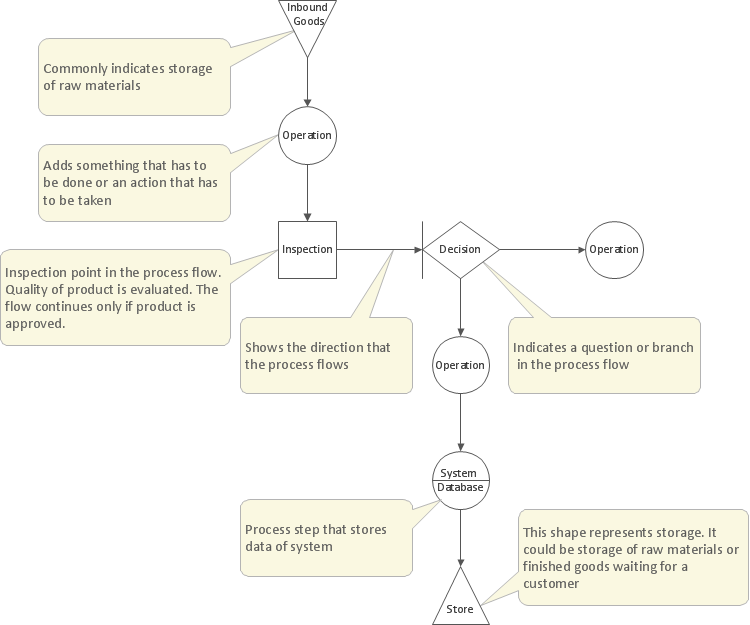
Picture: Create TQM Flowcharts for Mac
Related Solution: