Material Requisition Flowchart. Flowchart Examples

Flow chart Example. Warehouse Flowchart


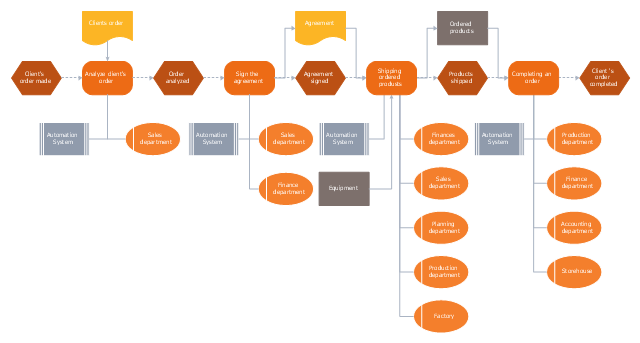
"Order processing is a key element of Order fulfillment. Order processing operations or facilities are commonly called "distribution centers". "Order processing" is the term generally used to describe the process or the work flow associated with the picking, packing and delivery of the packed item(s) to a shipping carrier. The specific "order fulfillment process" or the operational procedures of distribution centers are determined by many factors. Each distribution center has its own unique requirements or priorities. There is no "one size fits all" process that universally provides the most efficient operation." [Order processing. Wikipedia]
The business process modeling (BPM) flowchart example "Order processing - EPC flow chart" was created using the ConceptDraw PRO diagramming and vector drawing software extended with the Event-driven Process Chain Diagrams solution from the Business Processes area of ConceptDraw Solution Park.
The business process modeling (BPM) flowchart example "Order processing - EPC flow chart" was created using the ConceptDraw PRO diagramming and vector drawing software extended with the Event-driven Process Chain Diagrams solution from the Business Processes area of ConceptDraw Solution Park.
EPC flow chart
Value stream with ConceptDraw PRO

HelpDesk
Event-driven Process Chain (EPC) Diagram Software

Business Processes

"Order processing is a key element of Order fulfillment. Order processing operations or facilities are commonly called "distribution centers". "Order processing" is the term generally used to describe the process or the work flow associated with the picking, packing and delivery of the packed item(s) to a shipping carrier. The specific "order fulfillment process" or the operational procedures of distribution centers are determined by many factors. Each distribution center has its own unique requirements or priorities. There is no "one size fits all" process that universally provides the most efficient operation." [Order processing. Wikipedia]
The business process modeling (BPM) flowchart example "Order processing - EPC flow chart" was created using the ConceptDraw PRO diagramming and vector drawing software extended with the Event-driven Process Chain Diagrams solution from the Business Processes area of ConceptDraw Solution Park.
The business process modeling (BPM) flowchart example "Order processing - EPC flow chart" was created using the ConceptDraw PRO diagramming and vector drawing software extended with the Event-driven Process Chain Diagrams solution from the Business Processes area of ConceptDraw Solution Park.
EPC flow chart
HelpDesk
How to Create a VSM Diagram Using ConceptDraw Value Stream Mapping Solution
 example")
 Accounting Flowcharts
Accounting Flowcharts solution extends ConceptDraw PRO software with templates, samples and library of vector stencils for drawing the accounting flow charts.
Types of Flowcharts


Flowchart Symbols Accounting. Activity-based costing (ABC) flowchart

Bar Diagrams for Problem Solving. Create space science bar charts with Bar Graphs Solution

The vector stencils library "Workflow diagrams" contains 54 symbol icons of workflow diagrams.
Use these clipart to represent information flow, automation of business processes, business process re-engineering, accounting, management, and human resources tasks in industry, business, and manufacturing.
"The term workflow is more commonly used in particular industries, such as printing and professional domains, where it may have particular specialized meanings.
(1) Processes: A process is a more general notion than workflow and can apply to physical or biological processes, for instance; whereas a workflow is typically a process or collection of processes described in the context of work, such as all processes occurring in a machine shop.
(2) Planning and scheduling: A plan is a description of the logically necessary, partially ordered set of activities required to accomplish a specific goal given certain starting conditions. A plan, when augmented with a schedule and resource allocation calculations, completely defines a particular instance of systematic processing in pursuit of a goal. A workflow may be viewed as an (often optimal or near-optimal) realization of the mechanisms required to execute the same plan repeatedly.
(3) Flow control is a control concept applied to workflows, to distinguish from static control of buffers of material or orders, to mean a more dynamic control of flow speed and flow volumes in motion and in process. Such orientation to dynamic aspects is the basic foundation to prepare for more advanced job shop controls, such as just-in-time or just-in-sequence.
(4) In-transit visibility is a monitoring concept that applies to transported material as well as to work in process or work in progress, i.e., workflows." [Workflow. Wikipedia]
The example "Workflow diagram - Business" was drawn using the ConceptDraw PRO diagramming and vector drawing software extended with the Workflow Diagrams solution from the Business Processes area of ConceptDraw Solution Park.
Business - Work flow chart

Copying Service Process Flowchart. Flowchart Examples

Flowchart Marketing Process. Flowchart Examples

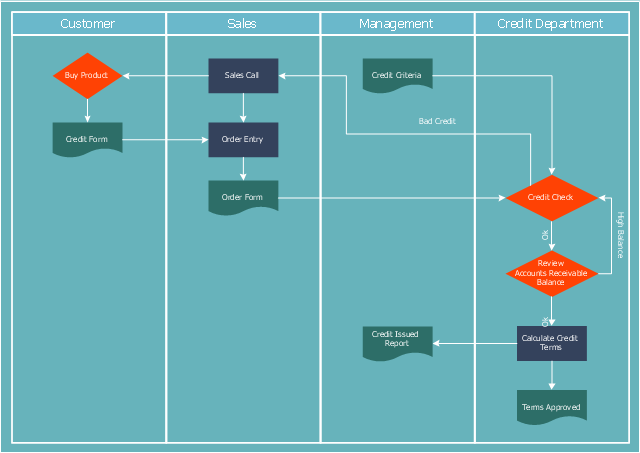
"Credit (from Latin credo translation. "I believe" ) is the trust which allows one party to provide resources to another party where that second party does not reimburse the first party immediately (thereby generating a debt), but instead arranges either to repay or return those resources (or other materials of equal value) at a later date. The resources provided may be financial (e.g. granting a loan), or they may consist of goods or services (e.g. consumer credit). Credit encompasses any form of deferred payment. Credit is extended by a creditor, also known as a lender, to a debtor, also known as a borrower." [Credit (finance). Wikipedia]
The cross-functional (deployment) flowchart example "Credit approval process" was created using the ConceptDraw PRO diagramming and vector drawing software extended with the Cross-Functional Flowcharts solution from the Business Processes area of ConceptDraw Solution Park.
The cross-functional (deployment) flowchart example "Credit approval process" was created using the ConceptDraw PRO diagramming and vector drawing software extended with the Cross-Functional Flowcharts solution from the Business Processes area of ConceptDraw Solution Park.
Cross-functional flow chart
The vector stencils library "Audit flowcharts" contains 31 symbols of audit flow chart diagrams for accounting, financial management, fiscal information tracking, money management, decision flowcharts, and financial inventories.
"A financial audit, or more accurately, an audit of financial statements, is the verification of the financial statements of a legal entity, with a view to express an audit opinion. The audit opinion is intended to provide reasonable assurance, but not absolute assurance, that the financial statements are presented fairly, in all material respects, and/ or give a true and fair view in accordance with the financial reporting framework. The purpose of an audit is to provide an objective independent examination of the financial statements, which increases the value and credibility of the financial statements produced by management, thus increase user confidence in the financial statement, reduce investor risk and consequently reduce the cost of capital of the preparer of the financial statements. ...
Financial audits are typically performed by firms of practicing accountants who are experts in financial reporting. The financial audit is one of many assurance functions provided by accounting firms. Many organizations separately employ or hire internal auditors, who do not attest to financial reports but focus mainly on the internal controls of the organization. External auditors may choose to place limited reliance on the work of internal auditors. Auditing promotes transparency and accuracy in the financial disclosures made by an organization, therefore would likely to reduce of such corporations to conceal unscrupulous dealings.
Internationally, the International Standards on Auditing (ISA) issued by the International Auditing and Assurance Standards Board (IAASB) is considered as the benchmark for audit process. Almost all jurisdictions require auditors to follow the ISA or a local variation of the ISA." [Financial audit. Wikipedia]
The example "Design elements - Audit flowchart" was created using the ConceptDraw PRO diagramming and vector drawing software extended with the Audit Flowcharts solution from the Finance and Accounting area of ConceptDraw Solution Park.
Audit flowchart symbols

Bar Diagrams for Problem Solving. Create event management bar charts with Bar Graphs Solution

- Process Flowchart | Flow process chart | Flow chart Example ...
- Material Requisition Flowchart. Flowchart Examples | Flow chart ...
- Flow process chart | Value stream with ConceptDraw PRO ...
- LLNL Flow Charts | Material Requisition Flowchart. Flowchart ...
- Process Flowchart | Flow chart Example. Warehouse Flowchart ...
- Flow chart Example. Warehouse Flowchart | Material Requisition ...
- Process Flowchart | Data Flow Diagram Model | Flow chart Example ...
- Flow process chart | Difference In Man Type And Material Type Of ...
- Process Flowchart | Types of Flowchart - Overview | Flow chart ...
- Basic Flowchart Symbols | Flow Chart Symbols | Process Flowchart ...
- Design elements - Data Flow Diagram (DFD) | How to Create ...
- Euclidean algorithm - Flowchart | Basic Flowchart Symbols and ...
- Warehouse Material Flow Chart
- Flow Chart Ordering System
- Material Requisition Flowchart. Flowchart Examples | Value stream ...
- Process Flowchart | Material Requisition Flowchart. Flowchart ...
- Flow process chart | Process flow diagram template | Cross ...
- Basic Flowchart Symbols and Meaning | Flowchart design ...
- Flow chart Example. Warehouse Flowchart | Logistics ...
- Process Flowchart | Types of Flowchart - Overview | Flow chart ...