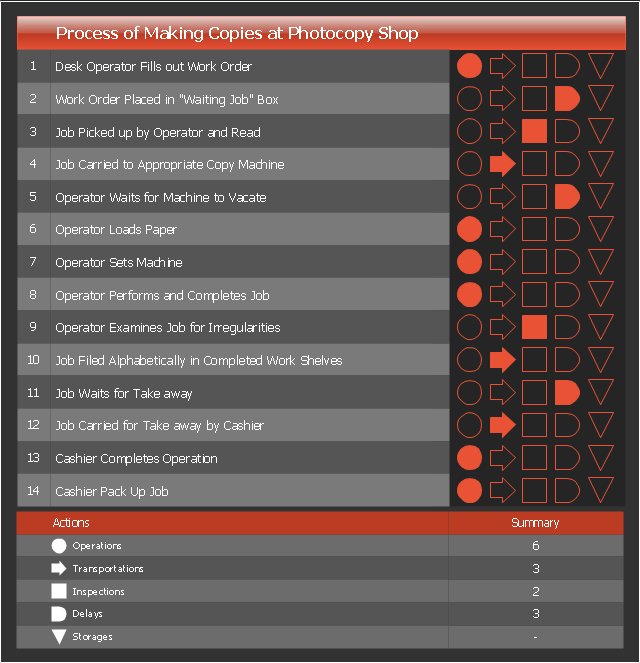
Flow process chart is used in quality control to display the action sequence of physical or manual process.
Flow process chart is useful for recording actions and documenting the production process.
Flow process chart helps to analyze and improve the process steps.
Flow process chart is more preferable than flowchart for documenting the mostly sequential processes.
Three types of flow process charts include: 1) man-type charts depicting the person actions, 2) material-type charts displaying the actions with product or material object, 3) equipment-type charts visualizing the useage of tools and equipment.
The set of symbols used in the flow process charts was developed by the American Society of Mechanical Engineers (ASME).
This flow process chart example was created using the ConceptDraw PRO diagramming and vector drawing software extended with the Matrices solution from the Marketing area of ConceptDraw Solution Park.
Flow process chart
Value stream with ConceptDraw PRO

Business Processes

 Universal Diagramming Area
This area collects solutions for drawing diagrams, charts, graphs, matrices, geographic and road maps for education, science, engineering, business.
 Accounting Flowcharts
Accounting Flowcharts solution extends ConceptDraw PRO software with templates, samples and library of vector stencils for drawing the accounting flow charts.
 Event-driven Process Chain Diagrams
Event-driven Process Chain (EPC) Diagram is a type of flowchart widely used for modeling in business engineering and reengineering, business process improvement, and analysis. EPC method was developed within the Architecture of Integrated Information Systems (ARIS) framework.
Bar Diagrams for Problem Solving. Create space science bar charts with Bar Graphs Solution

Flow chart Example. Warehouse Flowchart


 Value Stream Mapping
Value stream mapping solution extends ConceptDraw PRO software with templates, samples and vector stencils for drawing the Value Stream Maps (VSM) in lean manufacturing practice.
 Quality Mind Map
This solution extends ConceptDraw MINDMAP software with Quality Management Mind Maps (Presentations, Meeting Agendas, Problem to be solved).
How to Create a Social Media DFD Flowchart

Bar Diagrams for Problem Solving. Create event management bar charts with Bar Graphs Solution

 PM Easy
PM Easy solution extends the ConceptDraw PROJECT functionality with an ability to support neutral methodology of project management and to quickly start a project by listing the task relationships and dependencies, that makes the iterative planning much easier. The project management tool and available visual tools, such as mind mapping, increase the effectiveness of tracking and analysis your project tasks. PM Easy solution from ConceptDraw Solution Park is mainly targeted at project managers in small or medium-sized companies, allowing them to make the project plan and execute projects using mind mapping technique, to implement planning using mind mapping, and to track tasks using ConceptDraw PROJECT application.
 Maps
Maps
This solution extends ConceptDraw PRO v9.4 with the specific tools necessary to help you draw continental, directional, road, or transit maps, to represent international, business, or professional information visually.
Software development with ConceptDraw PRO

 Business Productivity Area
Business Productivity Solutions extend ConceptDraw products with tools for making presentations, conducting meetings, preparing documents, brainstorming, or building new strategies.
- Flow process chart | Example Process Flow | Example of Flowchart ...
- Flow process chart | Value stream with ConceptDraw PRO ...
- Flow process chart
- Process Flow app for Mac | Purchase Process Flow Chart | Business ...
- Process Flowchart | Work Flow Diagrams with ConceptDraw PRO ...
- Cross Functional Flowchart Examples | Types of Flowchart ...
- Flow process chart |
- Flow process chart | PM Agile |
- Cross-Functional Process Map Template | Flow process chart | TQM ...
- Types of Flowchart - Overview | Process Flowchart | Cross ...
- Fishbone diagram - Production process | Total Quality Management ...
- Process Flowchart | Cross-Functional Flowcharts | How to Simplify ...
- Army Flow Charts | LLNL Flow Charts | Cross-Functional Flowcharts |
- How to Draw an Organization Chart | Gant Chart in Project ...
- Universal Diagramming Area | Applications | Flow process chart |
- Types of Flowchart - Overview | Cross-Functional Flowcharts ...
- Purchase Process Flow Chart
- Flow Chart Diagram Examples | Cross-Functional Flowcharts ...
- Basic Flowchart Symbols | Flow Chart Symbols | Process Flowchart |
- Cross-Functional Flowcharts | Accounting Flowcharts | Process ...