The vector stencils library "Value stream mapping" contains 43 VSM symbols.
Use it for drawing value stream maps in the ConceptDraw PRO diagramming and vector drawing software extended with the Value Stream Mapping solution from the Quality area of ConceptDraw Solution Park.
www.conceptdraw.com/ solution-park/ business-value-stream-mapping
Use it for drawing value stream maps in the ConceptDraw PRO diagramming and vector drawing software extended with the Value Stream Mapping solution from the Quality area of ConceptDraw Solution Park.
www.conceptdraw.com/ solution-park/ business-value-stream-mapping
Inventory

Inventory

Information Flow
Shipment
Shipment

Material Flow
Material Pull

FIFO Line
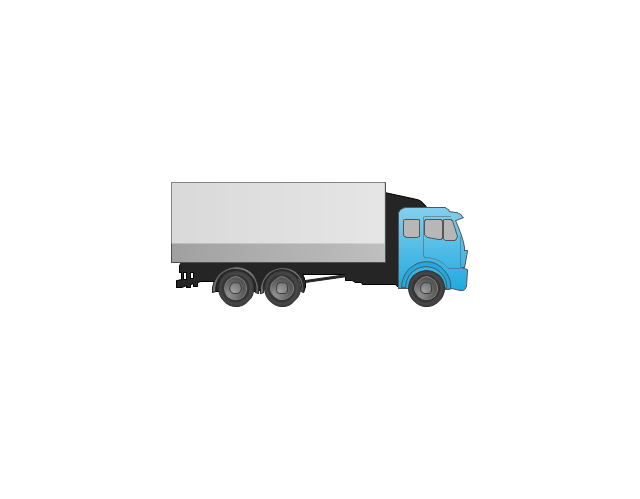
Truck shipment/Logistics
Customer/Supplier

Dedicated Process

Shared Process
Supermarket Parts

Data Box
Workcell

Kaizen Burst

Operator

Other
Production Control
Manual Info
Electronic Information Flow

Production Kanban

Withdrawal Kanban

Signal Kanban
Kanban Post

Sequenced Pull

Load Levelling

MRP/ERP
Go-See

Pull Arrow
Manual Info

Pull Arrow
Timeline Total
Ship
Forklift Truck
Plane

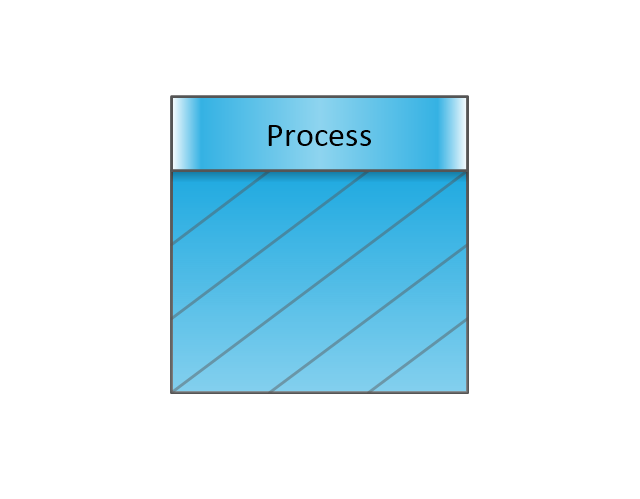
Process with Data
Timeline
Timeline
Supermarket, 2

Supermarket, 3

Safety stock, 2

Safety stock, 3

Value Stream Mapping Symbols

How to Create Flowcharts for an Accounting Information System

Data Flow Diagram

The vector stencils library "EPC diagrams" contains 23 EPC symbols.
Use it for drawing event-driven process chain (EPC) diagrams in the ConceptDraw PRO diagramming and vector drawing software extended with the Event-driven Process Chain Diagrams solution from the Business Processes area of ConceptDraw Solution Park.
www.conceptdraw.com/ solution-park/ business-process-EPC
Event
Function
Process path
XOR operator

OR operator
AND operator

Information/ Material Object
Organization Unit
Process Group
System
Comment 1

Comment 2

Control flow (Direct)
-epc-diagrams---vector-stencils-library.png--diagram-flowchart-example.png)
Information flow (Direct)
-epc-diagrams---vector-stencils-library.png--diagram-flowchart-example.png)
Organiztion unit assignment (Direct)
-epc-diagrams---vector-stencils-library.png--diagram-flowchart-example.png)
Control flow (Smart)
-epc-diagrams---vector-stencils-library.png--diagram-flowchart-example.png)
Information flow (Smart)
-epc-diagrams---vector-stencils-library.png--diagram-flowchart-example.png)
Organiztion unit assignment (Smart)
-epc-diagrams---vector-stencils-library.png--diagram-flowchart-example.png)
Information
Enterprise Area
Document
Database
Disk Storage
Data Flow Diagram Symbols. DFD Library

Design Data Flow. DFD Library

Accounting Data Flow from the Accounting Flowcharts Solution

Pyramid Diagram

The vector stencils library "Value stream mapping" contains 43 VSM symbols.
Use it for drawing value stream maps in the ConceptDraw PRO diagramming and vector drawing software extended with the Value Stream Mapping solution from the Quality area of ConceptDraw Solution Park.
www.conceptdraw.com/ solution-park/ business-value-stream-mapping
Use it for drawing value stream maps in the ConceptDraw PRO diagramming and vector drawing software extended with the Value Stream Mapping solution from the Quality area of ConceptDraw Solution Park.
www.conceptdraw.com/ solution-park/ business-value-stream-mapping
Inventory
Inventory
Information Flow
Shipment
Shipment
Material Flow
Material Pull
FIFO Line
Truck shipment/Logistics
Customer/Supplier
Dedicated Process
Shared Process
Supermarket Parts
Data Box
Workcell
Kaizen Burst
Operator
Other
Production Control
Manual Info
Electronic Information Flow
Production Kanban
Withdrawal Kanban
Signal Kanban
Kanban Post
Sequenced Pull
Load Levelling
MRP/ERP
Go-See
Pull Arrow
Manual Info
Pull Arrow
Timeline Total
Ship
Forklift Truck
Plane
Process with Data
Timeline
Timeline
Supermarket, 2
Supermarket, 3
Safety stock, 2
Safety stock, 3
Why Flowchart Important to Accounting Information System?

Accounting Flowchart: Purchasing, Receiving, Payable and Payment

Technical Flow Chart Example

Database Flowchart Symbols

Functional Flow Block Diagram

UML 2 4 Process Flow Diagram

Why is it important to have a formal purchasing process?

Types of Flowcharts


How to Create a Social Media DFD Flowchart

Flow Chart for Olympic Sports

- Information Flow Chart Of Mis
- Types Of Information Flow In An Organisation
- Information Flow Diagram For Marketing
- Value stream map - Template | How to Create a VSM Diagram Using ...
- Layout Of Information Flow In An Organization
- Layout Of Information Flow In An Organization For Mis
- Value stream mapping - Vector stencils library
- Information Flow Diagram In A Marketing Departments
- Workflow diagram - Weather forecast | Work Flow Chart | Types of ...
- HR Flowcharts | Flow Chart Of Human Resource Information System
- With The Aid Of A Diagram Discuss Information Flow
- EPC diagrams - Vector stencils library
- Information Oriented System Flow Chart Example
- How to Create Flowcharts for an Accounting Information System ...
- Data Flow Diagram Process | Why Flowchart Important to ...
- DFD Library System | Data Flow Diagram Symbols. DFD Library ...
- Flow Diagram Of Marketing Information System
- Pyramid Diagram | 4 Level pyramid model diagram - Information ...
- Information Flow Definition