Venn Diagram Examples for Problem Solving. Computer Science. Chomsky Hierarchy

Venn Diagram Examples for Problem Solving. Environmental Social Science. Human Sustainability Confluence

ConceptDraw Arrows10 Technology

Network Diagram Software Logical Network Diagram


Wiring Diagrams with ConceptDraw DIAGRAM

Formalization and Verification of Event-driven Process chain

Chemistry Drawing Software

Network Diagram Software. LAN Network Diagrams. Physical Office Network Diagrams

Technical Drawing Software

Mind Mapping Software

Mechanical Drawing Software

ORM Diagram

S Video Connection

ORM

Electrical Symbols — Analog and Digital Logic

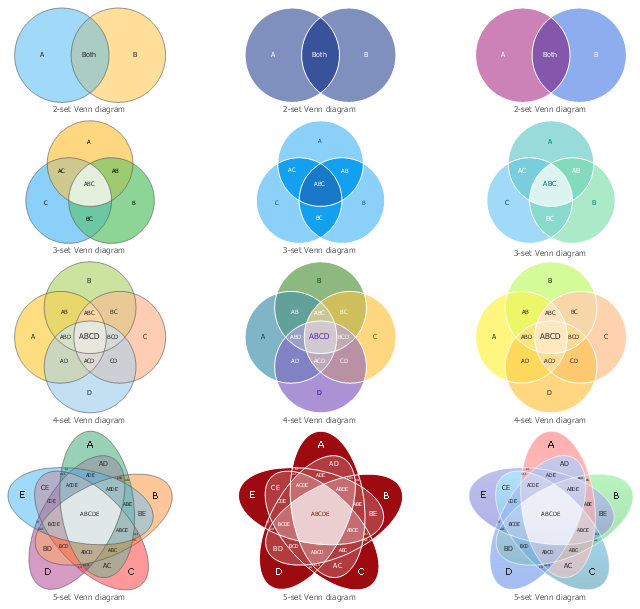
The vector stencils library "Venn diagrams" contains 12 templates. Use it for drawing Venn and Euler diagrams.
"A Venn diagram (also called a set diagram or logic diagram) is a diagram that shows all possible logical relations between a finite collection of different sets. Typically overlapping shapes, usually circles, are used, and an area-proportional or scaled Venn diagram is one in which the area of the shape is proportional to the number of elements it contains. These diagrams represent elements as points in the plane, and sets as regions inside curves. An element is in a set S just in case the corresponding point is in the region for S. They are thus a special case of Euler diagrams, which do not necessarily show all relations. Venn diagrams were conceived around 1880 by John Venn. They are used to teach elementary set theory, as well as illustrate simple set relationships in probability, logic, statistics, linguistics and computer science." [Venn diagram. Wikipedia]
The templates example "Design elements - Venn diagrams" was created using the ConceptDraw PRO diagramming and vector drawing software extended with the Venn Diagrams solution from the area "What is a Diagram" of ConceptDraw Solution Park.
Venn diagram templates
HelpDesk
How to Create an Object-Role Modeling (ORM) Diagram
 Diagram")
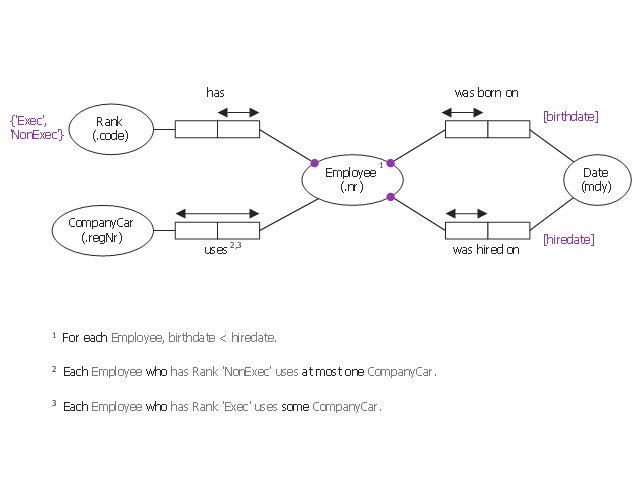
This object-role modeling (ORM) diagram sample shows model of employee data: birthdate, hiredate, rank, company car number. It was designed on the base of the Wikimedia Commons file: ORM-diagram-tkz-orm.png. [commons.wikimedia.org/ wiki/ File:ORM-diagram-tkz-orm.png]
"Facts.
Object-role models are based on elementary facts, and expressed in diagrams that can be verbalised into natural language. ...
This "fact-based" approach facilitates modeling, transforming, and querying information from any domain. ...
Attribute-free.
ORM is attribute-free: unlike models in the entity–relationship (ER) and Unified Modeling Language (UML) methods, ORM treats all elementary facts as relationships and so treats decisions for grouping facts into structures (e.g. attribute-based entity types, classes, relation schemes, XML schemas) as implementation concerns irrelevant to semantics. By avoiding attributes in the base model, ORM improves semantic stability and enables verbalization into natural language. ...
Fact-based modeling.
Fact-based modeling includes procedures for mapping facts to attribute-based structures, such as those of ER or UML. ...
Fact-based graphical notations are more expressive than those of ER and UML. ...
Design procedure.
System development typically involves several stages such as: feasibility study; requirements analysis; conceptual design of data and operations; logical design; external design; prototyping; internal design and implementation; testing and validation; and maintenance." [Object-role modeling. Wikipedia]
The object-role modeling diagram example "Employee ORM diagram" was designed using ConceptDraw PRO software extended with ORM Diagrams solution from Software Development area of ConceptDraw PRO Solution Park.
Object-role model
Venn Diagram Examples for Problem Solving

 Object-Role Modeling (ORM) Diagrams
Object-role Modeling (ORM) Diagram solution with powerful vector diagramming and data modeling tools, large quantity of specially developed samples and examples, and rich variety of vector objects corresponding to common ORM notation, ideally suits for developing the comprehensive, clear and visual Object-role Modeling (ORM) diagrams and schematics, understandable for all interested people from the different fields and business directions, for designing the ORM models, and demonstrating advantages from the use of ORM and its notation. It is intended for software developers and computer engineers, specialists in a field of Object-oriented programming (OOP), database architects, web-application constructors and developers, etc.
- Venn Diagram Examples for Problem Solving. Venn Diagram as a ...
- Basketball Court Dimensions | Elementary School Basketball ...
- Basketball Court Dimensions | Basketball Court Diagram and ...
- Accounting Flowcharts | Venn Diagram | Elementary Knowledge Of ...
- Line Diagram For School Building
- Solving quadratic equation algorithm - Flowchart | Physics | Venn ...
- Elementary Particles
- Example Of Elementary Flowchart
- Proton-proton chain reaction diagram | Nuclear physics - Vector ...
- Standard Model theory | Physics | Elementary Particles Of Standard ...
- Bubble Diagrams | School and Training Plans | Office Layout Plans ...
- Manufacturing 8 Ms fishbone diagram - Template | 8m Method ...
- Physics Diagrams | Design elements - Nuclear physics | Standard ...
- Basketball Court Diagram and Basketball Positions | Basketball ...
- Physics | Elementary Particle Flow Chart
- Design elements - Nuclear physics | Standard Model theory ...
- How to Draw a Chemical Process Flow Diagram | Chemical and ...
- Create Block Diagram | What is a Cross Functional Flow Chart ...
- Logical network topology diagram | Diagram Of Ring Topology