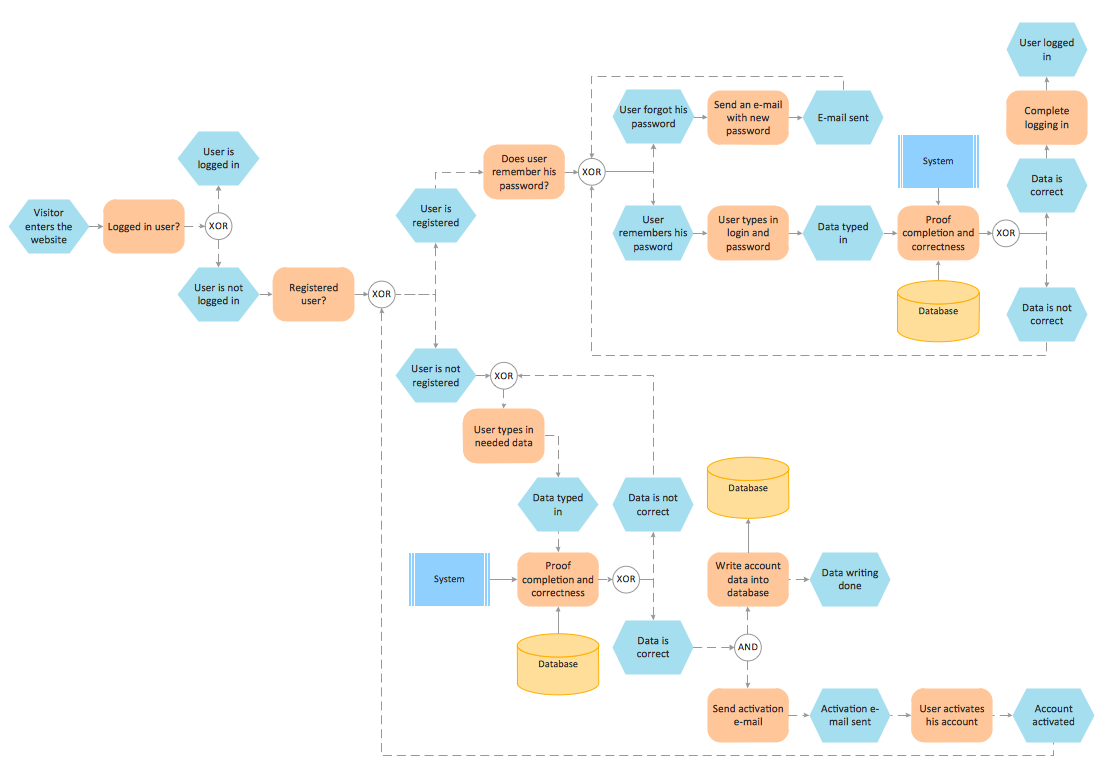
Pic.1 EPC diagram sample: Login and registration processing.
The Event-driven Process Chain Diagrams solution extends ConceptDraw DIAGRAM software with EPC templates, samples, and vector shape library for the drawing of EPC business process flowcharts.
The Event-driven Chain Diagrams solution assists in the planning of resources and improves business processes using EPC flowcharts.
TEN RELATED HOW TO's:
This sample was created in ConceptDraw DIAGRAM diagramming and vector drawing software using the UML Class Diagram library of the Rapid UML Solution from the Software Development area of ConceptDraw Solution Park.
This sample shows the transport protocol mappings for SNMP (Simple Network Management Protocol), the classes of the transport system and relationships between them and is used in IP network.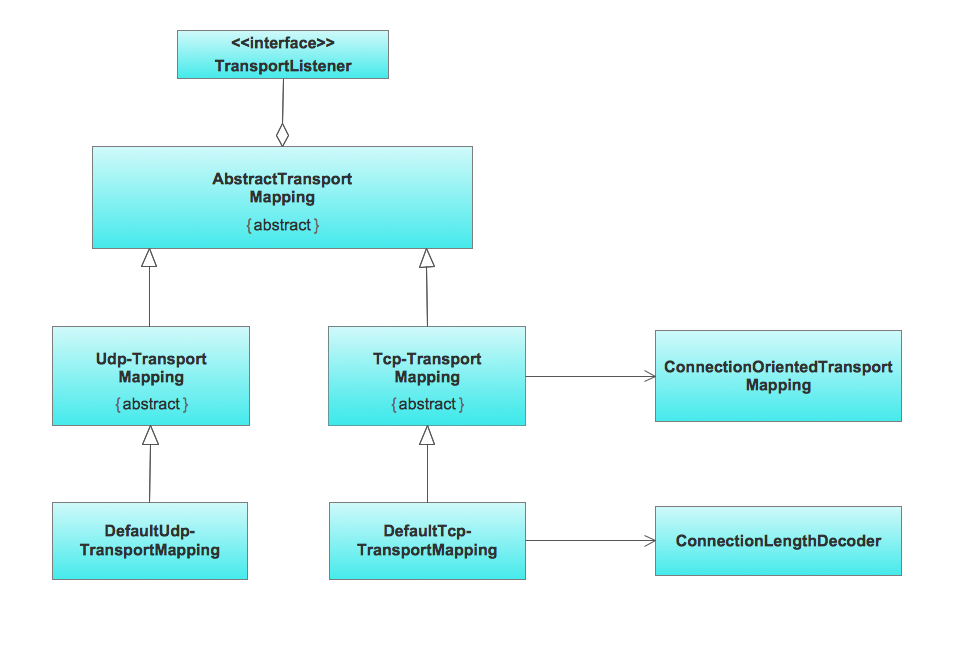
Picture: UML Class Diagram Example for Transport System
Related Solution:
When creating ER diagrams, you can apply different color ER diagram styles and also notation styles. ConceptDraw DIAGRAM enhanced with Entity-Relationship Diagram (ERD) Solution gives the ability to draw visual and attractive ER Diagrams using the style icons from Crow’s Foot notation and Chen's notation professionally designed and offered by ERD Chen's Notation and ERD Crow’s Foot Notation libraries.
Picture: ER Diagram Styles
Related Solution:
An event-driven process chain diagram is a flowchart used in business process analysis. It evolved from Architecture of Integrated Information Systems (ARIS) and utilised in the business process improvement and analysis. It is also used to facilitate enterprise resource planning.
An EPC diagram is a complex flowchart that shows different business processes through various workflows. The workflows are seen as functions and events that are connected by different teams or people, as well as tasks that allow business processes to be executed.
ConceptDraw DIAGRAM is a software for making EPC diagrams that allows managers visually present business process models for making decisions for business.
Picture: How to Draw EPC Diagram Quickly
Related Solution:
This sample was created in ConceptDraw DIAGRAM diagramming and vector drawing software using the Computer and Networks solution from Computer and Networks area of ConceptDraw Solution Park.
A Daisy Chain is the simple computer network. It is the easiest way to add more Ethernet devices into the network. In the Daisy Chain network one computer is connected to the next without any intervening devices, thus the message is sent from one computer to the next and then to the next and so on. A Daisy Chain can be linear or ring
Picture: Daisy Chain Network Topology
Related Solution:
The Total Quality Management Diagram solution helps you and your organization visualize business and industrial processes. Create Total Quality Management diagrams for business process with ConceptDraw software.
Picture: Total Quality Management Value
Related Solution:
Use the set of special professionally developed swim lane flowchart symbols - single, multiple, vertical and horizontal lanes from the Swimlanes and Swimlanes BPMN 1.2 libraries from the Business Process Diagram solution, the Swim Lanes library from the Business Process Mapping solution as the perfect basis for your Swim Lane Flowcharts of processes, algorithms and procedures.
Picture: Swim Lane Flowchart Symbols
Related Solution:
Create bar charts for business management problem solving and data comparison using the ConceptDraw DIAGRAM diagramming and vector drawing software extended with the Bar Graphs Solution from the Graphs and Charts area of ConceptDraw Solition Park.
Picture: Bar Diagrams for Problem Solving.Create business management bar charts with Bar Graphs Solution
Related Solution:
Create your own flow charts of computer or network system account processing using the ConceptDraw DIAGRAM.
Picture:
Account Flowchart
Flowchart Examples
Related Solution:
ConceptDraw DIAGRAM enhanced with Flowcharts Solution is the best flow chart maker online design software. Use it to ✔️ create clear and actionable Flowcharts, ✔️ improve decision-making, ✔️ enhance problem-solving in various scenarios, ✔️ enhance creativity and productivity across industries, ✔️ streamline workflows
Picture: Flow Chart Online
Related Solution:
Use the Basic Diagramming Solution from the Universal Diagramming area of ConceptDraw Solution Park to easy create simple forms, questionnaires, survey forms, registration and application forms, etc.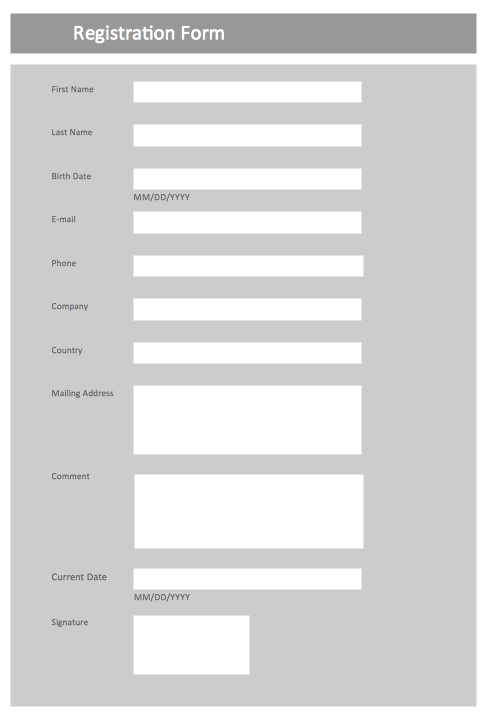
Picture: Form Maker
Related Solution: