Material Requisition Flowchart. Flowchart Examples

Value stream with ConceptDraw PRO

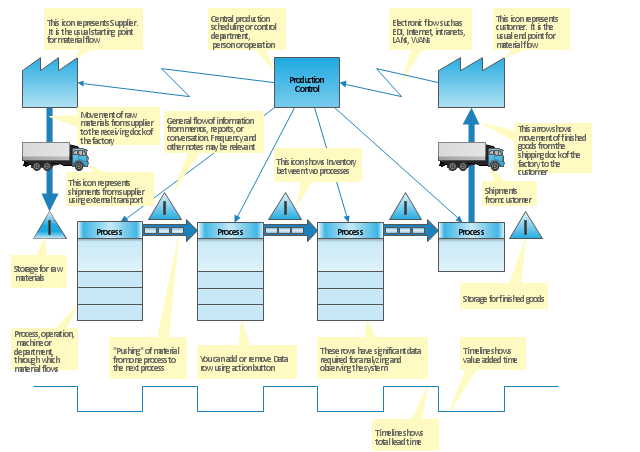
"Value stream mapping is a lean management principle used to analyze and design the flow of materials and information required to bring a product or service to a consumer. Pioneered by Henry Ford in the 1920s, perfected by Toyota. At Toyota, it is known as "material and information flow mapping". It can be applied to nearly any value chain. ...
Value stream mapping has supporting methods that are often used in Lean environments to analyze and design flows at the system level (across multiple processes).
Although value stream mapping is often associated with manufacturing, it is also used in logistics, supply chain, service related industries, healthcare, software development, product development, and administrative and office processes." [Value stream mapping. Wikipedia]
This value stream map template explains the meanings of the VSM design elements.
This Value stream map template for the ConceptDraw PRO diagramming and vector drawing software is included in the Value Stream Mapping solution from the Quality area of ConceptDraw Solution Park.
VSM template
Business Processes

The vector stencils library "Workflow diagrams" contains 54 symbol icons of workflow diagrams.
Use these clipart to represent information flow, automation of business processes, business process re-engineering, accounting, management, and human resources tasks in industry, business, and manufacturing.
"The term workflow is more commonly used in particular industries, such as printing and professional domains, where it may have particular specialized meanings.
(1) Processes: A process is a more general notion than workflow and can apply to physical or biological processes, for instance; whereas a workflow is typically a process or collection of processes described in the context of work, such as all processes occurring in a machine shop.
(2) Planning and scheduling: A plan is a description of the logically necessary, partially ordered set of activities required to accomplish a specific goal given certain starting conditions. A plan, when augmented with a schedule and resource allocation calculations, completely defines a particular instance of systematic processing in pursuit of a goal. A workflow may be viewed as an (often optimal or near-optimal) realization of the mechanisms required to execute the same plan repeatedly.
(3) Flow control is a control concept applied to workflows, to distinguish from static control of buffers of material or orders, to mean a more dynamic control of flow speed and flow volumes in motion and in process. Such orientation to dynamic aspects is the basic foundation to prepare for more advanced job shop controls, such as just-in-time or just-in-sequence.
(4) In-transit visibility is a monitoring concept that applies to transported material as well as to work in process or work in progress, i.e., workflows." [Workflow. Wikipedia]
The example "Workflow diagram - Business" was drawn using the ConceptDraw PRO diagramming and vector drawing software extended with the Workflow Diagrams solution from the Business Processes area of ConceptDraw Solution Park.
Business - Work flow chart

Flow chart Example. Warehouse Flowchart


 Accounting Flowcharts
Accounting Flowcharts solution extends ConceptDraw PRO software with templates, samples and library of vector stencils for drawing the accounting flow charts.
Types of Flowcharts


Bar Diagrams for Problem Solving. Create space science bar charts with Bar Graphs Solution

 Value Stream Mapping
Value stream mapping solution extends ConceptDraw PRO software with templates, samples and vector stencils for drawing the Value Stream Maps (VSM) in lean manufacturing practice.
 Quality Mind Map
This solution extends ConceptDraw MINDMAP software with Quality Management Mind Maps (Presentations, Meeting Agendas, Problem to be solved).
 Universal Diagramming Area
This area collects solutions for drawing diagrams, charts, graphs, matrices, geographic and road maps for education, science, engineering, business.
Quality Mind Map Solution

- Flow chart Example. Warehouse Flowchart | Flow process chart ...
- Flow process chart | Flow process chart template | Material
- Types of Flowchart - Overview | Flow chart Example. Warehouse ...
- Flow process chart | Value stream with ConceptDraw PRO ...
- Flow chart Example. Warehouse Flowchart | Types of Flowchart ...
- Material Requisition Flowchart. Flowchart Examples | Types of ...
- Process Flowchart | Work Flow Diagrams with ConceptDraw PRO ...
- Purchase Process Flow Chart. Accounting Flowchart Example ...
- Types of Flowchart - Overview | Flow Diagram Software | Flow chart ...
- Pyramid Diagram | How well does Your Purchase Process Flow ...
- Purchase Process Flow Chart. Accounting Flowchart Example ...
- Accounting Flowcharts | Types of Flowchart - Overview | Flowchart ...
- Cross-Functional Flowcharts | Work Order Process Flowchart ...
- Cross Functional Flowchart Examples | Flow chart Example ...
- Design elements - Data Flow Diagram (DFD) | How to Create ...
- Cross-Functional Flowchart | Types of Flowchart - Overview | Cross ...
- Cross-Functional Flowcharts | How to Simplify Flow Charting ...
- Flow chart Example. Warehouse Flowchart | Workflow diagram ...
- Types of Flowchart - Overview | Types of Flowcharts | Cubetto ...
- Flow process chart