Decision Making
Decision Making - ConceptDraw Office suite provides visual tools that are given support on the stage of the decision making. The Seven Management and Planning Tools is a set for such diagrams: Affinity Diagram, Relations Diagram, Prioritization Matrix, Root Cause Tree Diagram, Involvement Matrix, PERT Chart, Risk Diagram (PDPC).
Pyramid Diagram
The Time-Money-Quality Triangle illustrates an advertising truism, that you can't have all three.
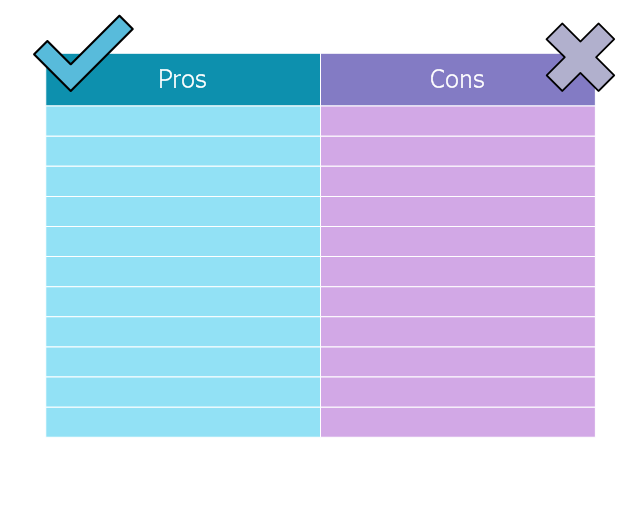
This is T-chart template for ConceptDraw software.
"T-Chart.
A simple way to conduct economic analysis through partial budgeting is with a T-chart. A T-chart systematically identifies only the benefits and costs of a conservation alternative. This technique simplifies data collection and analysis. The T-chart also describes the resource setting, resource concerns and the conservation system. The best information used in the T-chart comes from your client, a discipline specialist’s recommendations, and technical references. ...
There can be three levels of analysis using the T-chart:
• Level I Includes only qualitative statements
• Level II Qualitative statement plus units of measurement and dollars
• Level III Complete economic or financial analysis
The conservation planner should complete as many T-chart levels as they are comfortable with and then request assistance if the decision maker needs additional analysis. The planner only develops enough information for the client to make an informed decision. The decision maker may lose interest if too much irrelevant information is provided and waste planner’s time. A T-chart can be developed on whatever media the decision maker finds most useful." [nrcs.usda.gov/ Internet/ FSE_ DOCUMENTS/ stelprdb1176611.pdf]
The template "T-chart" is included in Decision Making solution from Management area of ConceptDraw Solution Park.
Pyramid Diagram
Pyramid diagram is a chart used to visualize the data in a hierarchical (pyramid-like) structure and depict the foundation-based relationships. Pyramid diagram looks like a triangle divided by lines into several sections (layers) and can be oriented up or down, and represented in 2D or 3D view. 2D Pyramid diagrams are a great way to illustrate the hierarchical structure, 3D Pyramids are equally good to represent the class stratification and hierarchy. ConceptDraw DIAGRAM diagramming and vector drawing software with included Pyramid Diagrams solution from Marketing area of ConceptDraw Solution Park is a powerful application which contains templates and library of vector design elements for instantly drawing three level Pyramid model, four level and five level Triangle charts. All predesigned objects are easy for changing color style and resizing according to your needs, and ConceptDraw documents with Pyramid diagrams can be easy exported in various formats for further using in marketing presentations, for effective analyzing hierarchy levels and illustration your data and ideas.Pyramid Diagram
The DIKW Pyramid refers loosely to a class of models for representing purported structural and/or functional relationships between data, information, knowledge, and wisdom.Helpful in all stages of quality management
ConceptDraw Mind maps can be used to depict a quality process.PDPC
ConceptDraw DIAGRAM extended with Seven Management and Planning Tools Solution from the Management Area of ConceptDraw Solution Park is the best software for drawing all types of diagrams from the Seven Management and Planning Tools: Affinity Diagram, Relations Diagram, Prioritization Matrix, Root Cause Analysis Tree Diagram, Involvement Matrix, PERT Chart, and Risk Diagram (PDPC).Export from ConceptDraw MINDMAP to PDF (Adobe Acrobat®) File
The export options in ConceptDraw MINDMAP allow mind maps to be exported in various graphical formats such as images, webpages, or PDF files. They can also be exported into Microsoft Office applications or into different mindmapping programs.Pyramid Diagram and Pyramid Chart
Pyramid Diagram, Triangle Chart or Triangular Diagram is a convenient and useful type of diagrams, which lets represent the data hierarchical structure and to illustrate the foundation-based relationships between the hierarchy levels. Pyramid Diagrams are used to visualize effectively the hierarchical, as well as proportional and foundation-based relationships, the process steps, the interconnections of organizational layers or topics. ConceptDraw DIAGRAM software enhanced with Pyramid Diagrams solution from Marketing area of ConceptDraw Solution Park is a powerful business charting software, that includes all required tools for designing the multilevel Pyramid Diagrams as quickly as possible. The build-in vector stencils and templates are the great aid for designers, a variety of examples and samples is a good base and source of inspiration. Use attractive and vivid 2D and 3D Pyramid Diagrams and Triangle Charts designed in ConceptDraw DIAGRAM to illustrate your documents, presentations, infographics, articles, reports, websites, etc.Marketing Infographics
Marketing Infographics is a very popular tool that allows to represent the complex data, knowledge, and other marketing information in a simple, visual and attractive graphical form. But how to draw Marketing Infographics simply and quickly? ConceptDraw DIAGRAM diagramming and vector drawing software extended with unique Marketing Infographics Solution from the Business Infographics Area will help you design marketing infographics without efforts. This toolset included in ConceptDraw Office for small business project management, creating presentations using marketing infographics is critical part project management reporting software.HelpDesk
How to Change the Font for an Entire Level of a Mind Map
The visual representation of information is much more productive than simple linear transfer because it is more natural for our brain to understand information in the form of visual images. ConceptDraw MINDMAP will help you put your thoughts and ideas across to any audience in the most intelligible and memorable way. Mind maps can be used in a great number of situations involving analysis, learning, research, and thinking. Use them for personal planning, preparing lists, working on projects, as well as analyzing problems and finding solutions. ConceptDraw MINDMAP provides a variety of style and formatting options for your mind maps, that let you add more information to your mind map without interfering with its readability.Organizational Structure Diagram Software
ConceptDraw DIAGRAM extended with Organizational Charts Solution from the Management Area is a powerful but easy-to-use Organizational Structure Diagram Software. Organizational Charts Solution provides a wide variety of templates and samples and large quantity of predesigned vector objects to help you design your Organizational Structure Diagrams and other business diagrams.
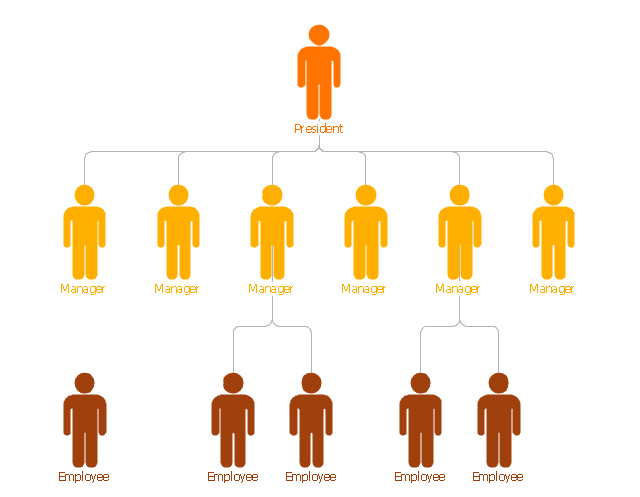
"A flat organization (also known as horizontal organization or delayering) is an organization that has an organizational structure with few or no levels of middle management between staff and executives. The idea is that well-trained workers will be more productive when they are more directly involved in the decision making process, rather than closely supervised by many layers of management.
This structure is generally possible only in smaller organizations or individual units within larger organizations. When they reach a critical size, organizations can retain a streamlined structure but cannot keep a completely flat manager-to-staff relationship without impacting productivity. ...
The flat organization model promotes employee involvement through a decentralized decision-making process. By elevating the level of responsibility of baseline employees and eliminating layers of middle management, comments and feedback reach all personnel involved in decisions more quickly. Expected response to customer feedback becomes more rapid." [Flat organization. Wikipedia]
This flat org chart template for the ConceptDraw PRO diagramming and vector drawing software is included in the 25 Typical Organizational Charts solution from the Management area of ConceptDraw Solution Park.
Organizational Chart
Organizational Chart is useful and perspective tool, which helps to illustrate the structure of an organization and relationships between personnel or departments. It is simple, but at the same time capacious graphical representation. ConceptDraw MINDMAP software is powerful in questions of brainstorming, designing Mind Maps and Organizational Charts, making professional presentations, building effective strategies, preparing documents and conducting meetings. ConceptDraw Office applications allow create Organizational Chart from your map in one click. Use numerous advantages of hierarchical tree structure of Mind Map when developing the organizational structure of your organization. Pay also attention on helpful Business Productivity solutions supported by ConceptDraw Solution Park, which assist managers and knowledge workers in making their jobs easier and save their time. The flexibility of ConceptDraw Office and the use of content that has already been developed and offered by ConceptDraw Solution Park as well as ability to repurpose it according to your requirements, help you effectively respond to any eventuality.Create Response Charts
Visual navigation through the stages of a response process helps you locate specific actions to be taken via Action Mind Maps. Use ConceptDraw DIAGRAM and ConceptDraw MINDMAP for organize the process of response for interactions occurring in social media.Decision Making Software For Small Business
A software tool that saves your time on making decisions now has the ability to make decisions with remote team via Skype.
Flow Chart Online
Flow Chart is a great visualization tool for the flow of a process, algorithm or procedure with a lot of benefits. It is convenient to use a powerful software for creating flow charts. Now we have the best flow chart maker online design software - ConceptDraw DIAGRAM enhanced with Flowcharts Solution from the "Diagrams" Area of ConceptDraw Solution Park.Organizational Structure Types
There are three main types of organizational structures which can be adopted by organizations depending on their objectives: functional structure, divisional structure, matrix structure. ConceptDraw DIAGRAM diagramming and vector drawing software enhanced with 25 Typical Orgcharts solution from the Management area of ConceptDraw Solution Park is ideal for designing diagrams and charts of any organizational structure types.Organizational Structure
The organizational structure reflects the composition and hierarchy of company's divisions, determines the distribution of authorities and responsibilities within the organization, and facilitates the understanding by workers their responsibilities. It also defines the group of people making key decisions at the company. Visualization of organizational structure of any company, organization or institution is not an easy task, because sometimes the company may include several departments, each with more than thousand persons. For such large organizations often are created the Organizational charts for every department separately. There are many ways of organization's structuring, which determine its work. Often happens that organizational structure adapts to production process. ConceptDraw DIAGRAM extended with unique Organizational Charts solution from Management area of ConceptDraw Solution Park is a powerful organizational structure software, which ideally suits for developing Organizational Charts of any type and any complexity.- With Aid Of Diagram Illustrate The Stages Of Decision Making In Mis
- 4 Level pyramid model diagram - Information systems types | 5 Level ...
- 5 Level pyramid model diagram - Information systems types | 4 Level ...
- Decision Making | Workflow Diagram | Pyramid Diagram | Diagrame ...
- Decision Making | Pyramid Diagram | Workflow Diagram | Decision ...
- Decision Making | Pyramid Diagram | Basic Flowchart Symbols and ...
- Decision tree diagram | Marketing Diagrams | High level fault tree ...
- Decision Making | How To Make the Right Decision in Projects ...
- Decision Making Cycle Diagram In Mis
- 3 Level pyramid model diagram - Information systems types | 4 Level ...
- 4 Level pyramid model diagram - Information systems types | 5 Level ...
- PDPC | Risk diagram (PDPC) - Template | Process decision ...
- 3 Level pyramid model diagram - Information systems types | IDEF3 ...
- Press Releases - ConceptDraw
- 5 Level pyramid model diagram - Information systems types ...
- Flat org chart 3 - Template
- Process decision program chart (PDPC) - Personal activity | Process ...
- Process decision program chart (PDPC) - Personal activity | Risk ...
- Risk Diagram (Process Decision Program Chart) | Risk Diagram ...
- 5 Level pyramid model diagram - Information systems types ...