"A decision tree is a decision support tool that uses a tree-like graph or model of decisions and their possible consequences, including chance event outcomes, resource costs, and utility. It is one way to display an algorithm.
Decision trees are commonly used in operations research, specifically in decision analysis, to help identify a strategy most likely to reach a goal. ...
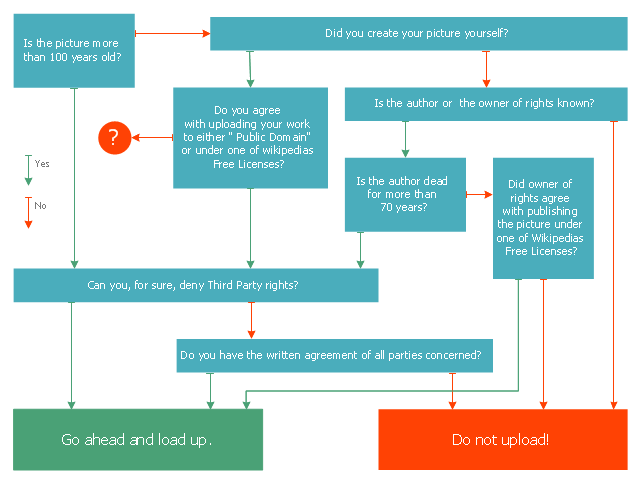
A decision tree is a flowchart-like structure in which internal node represents test on an attribute, each branch represents outcome of test and each leaf node represents class label (decision taken after computing all attributes). A path from root to leaf represents classification rules.
In decision analysis a decision tree and the closely related influence diagram is used as a visual and analytical decision support tool, where the expected values (or expected utility) of competing alternatives are calculated.
A decision tree consists of 3 types of nodes:
(1) Decision nodes - commonly represented by squares.
(2) Chance nodes - represented by circles.
(3) End nodes - represented by triangles.
Decision trees are commonly used in operations research, specifically in decision analysis, to help identify a strategy most likely to reach a goal." [Decision tree. Wikipedia]
This marketing diagram sample was redesigned from the Wikimedia Commons file: Decision Tree on Uploading Imagesv2.svg.
[commons.wikimedia.org/ wiki/ File:Decision_ Tree_ on_ Uploading_ Imagesv2.svg]
The marketing diagram example "Decision tree" was created using the ConceptDraw PRO diagramming and vector drawing software extended with the Marketing Diagrams solution from the Marketing area of ConceptDraw Solution Park.
www.conceptdraw.com/ solution-park/ marketing-diagrams
Decision trees are commonly used in operations research, specifically in decision analysis, to help identify a strategy most likely to reach a goal. ...
A decision tree is a flowchart-like structure in which internal node represents test on an attribute, each branch represents outcome of test and each leaf node represents class label (decision taken after computing all attributes). A path from root to leaf represents classification rules.
In decision analysis a decision tree and the closely related influence diagram is used as a visual and analytical decision support tool, where the expected values (or expected utility) of competing alternatives are calculated.
A decision tree consists of 3 types of nodes:
(1) Decision nodes - commonly represented by squares.
(2) Chance nodes - represented by circles.
(3) End nodes - represented by triangles.
Decision trees are commonly used in operations research, specifically in decision analysis, to help identify a strategy most likely to reach a goal." [Decision tree. Wikipedia]
This marketing diagram sample was redesigned from the Wikimedia Commons file: Decision Tree on Uploading Imagesv2.svg.
[commons.wikimedia.org/ wiki/ File:Decision_ Tree_ on_ Uploading_ Imagesv2.svg]
The marketing diagram example "Decision tree" was created using the ConceptDraw PRO diagramming and vector drawing software extended with the Marketing Diagrams solution from the Marketing area of ConceptDraw Solution Park.
www.conceptdraw.com/ solution-park/ marketing-diagrams
Decision tree diagram
 Marketing Diagrams
This solution extends ConceptDraw PRO with samples, templates and library of design elements for drawing the marketing diagrams.
This example was redesigned from the Wikimedia Commons file: Example of High Level Fault Tree.jpg. [commons.wikimedia.org/ wiki/ File:Example_ of_ High_ Level_ Fault_ Tree.jpg]
"Risk assessment is the determination of quantitative or qualitative value of risk related to a concrete situation and a recognized threat (also called hazard). Quantitative risk assessment requires calculations of two components of risk (R):, the magnitude of the potential loss (L), and the probability (p) that the loss will occur. Acceptable risk is a risk that is understood and tolerated usually because the cost or difficulty of implementing an effective countermeasure for the associated vulnerability exceeds the expectation of loss.
In all types of engineering of complex systems sophisticated risk assessments are often made within Safety engineering and Reliability engineering when it concerns threats to life, environment or machine functioning. The nuclear, aerospace, oil, rail and military industries have a long history of dealing with risk assessment. Also, medical, hospital, social service and food industries control risks and perform risk assessments on a continual basis. Methods for assessment of risk may differ between industries and whether it pertains to general financial decisions or environmental, ecological, or public health risk assessment." [Risk assessment. Wikipedia]
The FTA diagram example "High level fault tree" was created using the ConceptDraw PRO diagramming and vector drawing software extended with the Fault Tree Analysis Diagrams solution from the Engineering area of ConceptDraw Solution Park.
FTA diagram

- Decision tree diagram | Decision Making | Marketing Diagrams ...
- Decision tree diagram | Marketing Diagrams | Fault Tree Analysis ...
- Decision tree diagram | Marketing Diagrams | How To Create Root ...
- Types of Welding in Flowchart | Decision tree diagram | Computer ...
- Decision tree diagram | Influence Diagram | MS Visio Look a Like ...
- How To Create Root Cause Analysis Diagram | Types of Flowcharts ...
- How to Create a Fault Tree Analysis Diagram (FTD) in ConceptDraw ...
- Project —Task Trees and Dependencies | PROBLEM ANALYSIS ...
- Process Flowchart | Decision Making | CORRECTIVE ACTIONS ...
- Decision Making | PROBLEM ANALYSIS. Root Cause Analysis Tree ...
- Root cause analysis tree diagram - Template | PROBLEM ...
- Decision Making | Block diagram - Customer decision making ...
- Decision Making Trees In Healthcare
- PROBLEM ANALYSIS. Root Cause Analysis Tree Diagram ...
- Accident analytic tree - FTA diagram | Decision Making | How To use ...
- PROBLEM ANALYSIS. Root Cause Analysis Tree Diagram | Project ...
- Project — Assigning Resources | How To Implement Collaborative ...
- Decision Tree Template Visio
- Decision Making | CORRECTIVE ACTIONS PLANNING. Risk ...
- Example Decision Tree Diagram Software