Decision Making


How To Make the Right Decision in Projects


Decision Making Software For Small Business

Problem solving

Influence Diagram Software

Corrective Action Planning

The Action Plan

Workflow Diagram

Preventive Action

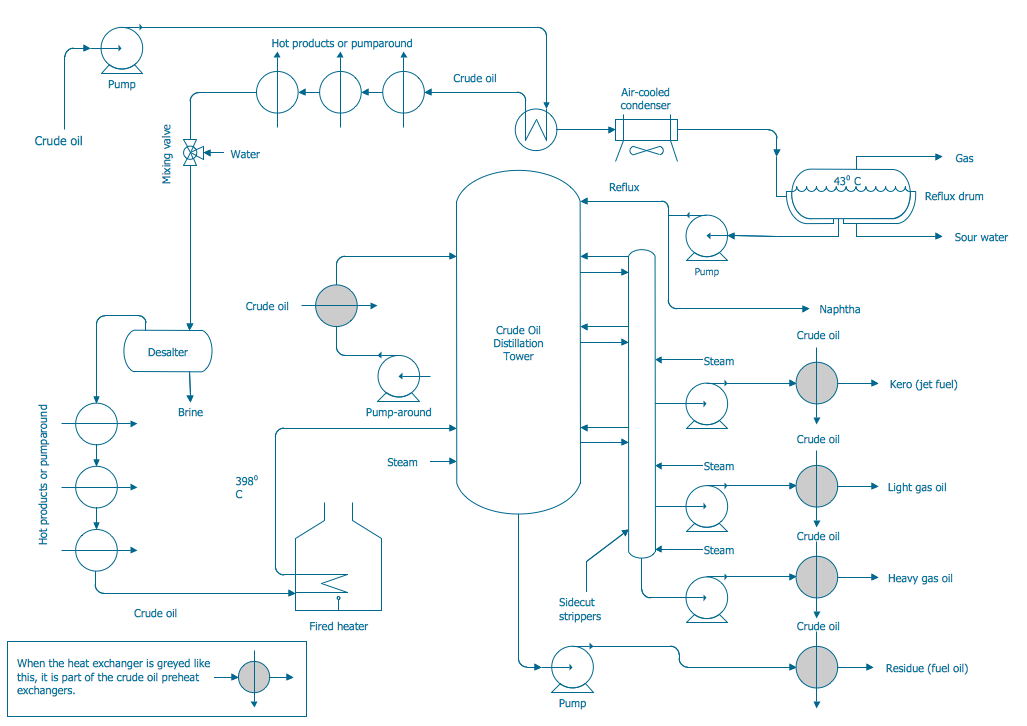
Process and Instrumentation Diagram
Relationships Analysis

How to Draw Business Process Diagrams with RapidDraw Interface

Pyramid Diagram and Pyramid Chart

PROBLEM ANALYSIS. Identify and Structure Factors

Cause and Effect Analysis

- Decision Making | Block diagram - Customer decision making ...
- Decision Making | Influence Diagram Software | Fault Tree Diagram ...
- Diagram For Decision Making Process
- Pyramid Diagram | Decision Making | Basic Flowchart Symbols and ...
- Decision Diagram
- Decision Making Tree Diagram
- Decision Making | Seven Management and Planning Tools ...
- TQM Diagram Tool | Decision Making | PROBLEM ANALYSIS. Root ...
- Total Quality Management Business Diagram | TQM Tools | Decision ...
- Cause and Effect Analysis | Influence Diagram Software | Decision ...
- Decision Making | Problem solving | Workflow Diagram | Diagrams ...
- Influence Diagram Software | Organization Chart Software | Decision ...
- Decision Making | PROBLEM ANALYSIS. Prioritization Matrix ...
- Decision Making | Problem solving | Preventive Action | Decision ...
- Fishbone Diagram Problem Solving | Using Fishbone Diagrams for ...
- Cause and Effect Analysis | Decision Making | Influence Diagram ...
- Decision Making | Influence Diagram Software | Root Cause Tree ...
- PROBLEM ANALYSIS. Root Cause Analysis Tree Diagram | TQM ...
- Decision Making
- With The Use Of A Diagram Illustrate The Stages Of Decision Making