A KPI Dashboard

A KPI Dashboard Provides the Answers Your Sales Team

Sales KPI Dashboards

KPIs and Metrics

Visualize Sales Data Using Sample Data

 Sales Dashboard
Sales Dashboard solution extends ConceptDraw PRO software with templates, samples and library of vector stencils for drawing the visual dashboards of sale metrics and key performance indicators (KPI).
This example was created using ConceptDraw PRO diagramming and vector drawing software extended with Sales Dashboard solution from Marketing area of ConceptDraw Solution Park.
https:/ / www.conceptdraw.com/ solution-park/ marketing-sales-dashboard
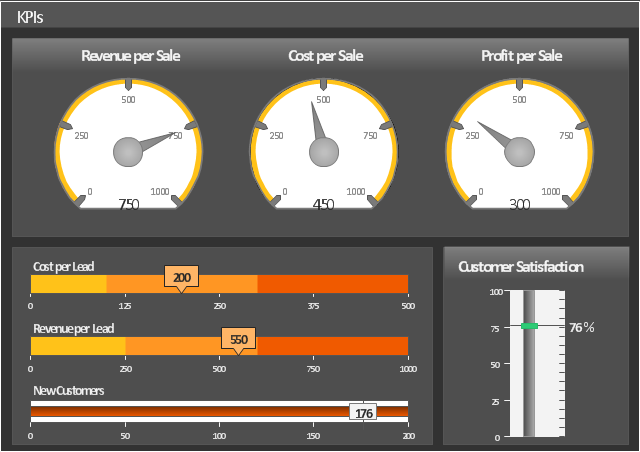
This sample indicates sale group effectiveness by different parameters, such as Revenue per Sale, Cost per Sale, Profit per Sale, Customer Satisfaction, Cost per Lead and Revenue per Lead.
https:/ / www.conceptdraw.com/ solution-park/ marketing-sales-dashboard
This sample indicates sale group effectiveness by different parameters, such as Revenue per Sale, Cost per Sale, Profit per Sale, Customer Satisfaction, Cost per Lead and Revenue per Lead.
KPIs
Sales Dashboard Solutions can help your sales team keep an eye on performance

Data Visualization Software Solutions

Sales Organization

Data Visualization Solutions

Sales Dashboards for Your Company

This financila dashboard example was drawn on the base of the Enterprise dashboard from the Mecklenburg County Government website.
[charmeck.org/ mecklenburg/ county/ CountyManagersOffice/ OMB/ dashboards/ Pages/ Enterprise.aspx]
"In management information systems, a dashboard is "an easy to read, often single page, real-time user interface, showing a graphical presentation of the current status (snapshot) and historical trends of an organization’s key performance indicators to enable instantaneous and informed decisions to be made at a glance."
For example, a manufacturing dashboard may show key performance indicators related to productivity such as number of parts manufactured, or number of failed quality inspections per hour. Similarly, a human resources dashboard may show KPIs related to staff recruitment, retention and composition, for example number of open positions, or average days or cost per recruitment.
Types of dashboards.
Dashboard of Sustainability screen shot illustrating example dashboard layout.
Digital dashboards may be laid out to track the flows inherent in the business processes that they monitor. Graphically, users may see the high-level processes and then drill down into low level data. This level of detail is often buried deep within the corporate enterprise and otherwise unavailable to the senior executives.
Three main types of digital dashboard dominate the market today: stand alone software applications, web-browser based applications, and desktop applications also known as desktop widgets. The last are driven by a widget engine.
Specialized dashboards may track all corporate functions. Examples include human resources, recruiting, sales, operations, security, information technology, project management, customer relationship management and many more departmental dashboards.
Digital dashboard projects involve business units as the driver and the information technology department as the enabler. The success of digital dashboard projects often depends on the metrics that were chosen for monitoring. Key performance indicators, balanced scorecards, and sales performance figures are some of the content appropriate on business dashboards." [Dashboard (management information systems). Wikipedia]
The example "Enterprise dashboard" was created using the ConceptDraw PRO diagramming and vector drawing software extended with the Composition Dashboard solution from the area "What is a Dashboard" of ConceptDraw Solution Park.
www.conceptdraw.com/ solution-park/ composition-dashboard
Financial dashboard

 Meter Dashboard
Meter dashboard solution extends ConceptDraw PRO software with templates, samples and vector stencils library with meter indicators for drawing visual dashboards showing quantitative data.
Sales Dashboard Screenshot

 PM Dashboards
This solution extends ConceptDraw PRO and ConceptDraw PROJECT software with the ability to clearly display the identified key performance indicators for any project.
Reporting Dashboard Software for Business
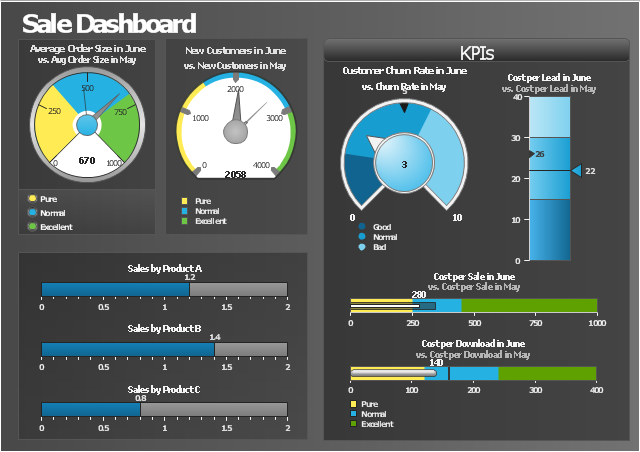
This sale dashboard example contains KPIs and sales effectiveness metrics visual indicators: speedometer gauge, dial, slider, level meter and bullet indicators.
"Sales effectiveness refers to the ability of a company’s sales professionals to “win” at each stage of the customer’s buying process, and ultimately earn the business on the right terms and in the right timeframe.
Improving sales effectiveness is not just a sales function issue; it’s a company issue, as it requires deep collaboration between sales and marketing to understand what’s working and not working, and continuous improvement of the knowledge, messages, skills, and strategies that sales people apply as they work sales opportunities.
Sales effectiveness has historically been used to describe a category of technologies and consulting services aimed at helping companies improve their sales results.
Many companies are creating sales effectiveness functions and have even given people titles such as VP of Sales Effectiveness." [Sales effectiveness. Wikipedia]
The example "Sale dashboard" was created using the ConceptDraw PRO diagramming and vector drawing software extended with the Meter Dashboard solution from the area "What is a Dashboard" of ConceptDraw Solution Park.
www.conceptdraw.com/ solution-park/ meter-dashboard
Sales dashboard
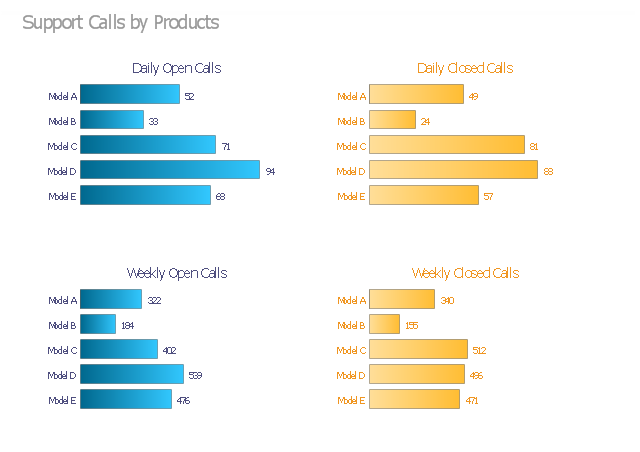
The visual dashboard example "Support calls by products" contains 4 horizontal bar charts used for the comparison of support calls data by products.
"Dashboards often provide at-a-glance views of KPIs (key performance indicators) relevant to a particular objective or business process (e.g. sales, marketing, human resources, or production). ... Dashboards give signs about a business letting the user know something is wrong or something is right. The corporate world has tried for years to come up with a solution that would tell them if their business needed maintenance or if the temperature of their business was running above normal. Dashboards typically are limited to show summaries, key trends, comparisons, and exceptions." [Dashboard (business). Wikipedia]
The business dashboard example "Support calls by products" was created using the ConceptDraw PRO diagramming and vector drawing software extended with the Comparison Dashboard solution from the area "What is a Dashboard" of ConceptDraw Solution Park.
www.conceptdraw.com/ solution-park/ comparison-dashboard
Visual dashboard
- Sales Dashboard Template | Sales KPI Dashboards | Visualize ...
- A KPI Dashboard | A KPI Dashboard Provides the Answers Your ...
- A KPI Dashboard | A KPI Dashboard Provides the Answers Your ...
- A KPI Dashboard
- Sales KPI Dashboards
- A KPI Dashboard | A KPI Dashboard Provides the Answers Your ...
- Sales KPI Dashboards | Sales Dashboard Template | A KPI
- A KPI Dashboard Provides the Answers Your Sales Team
- KPIs and Metrics | A KPI Dashboard | Sales KPI Dashboards |
- Sales Dashboards for Your Company | Frequency Distribution ...
- A KPI Dashboard | Sales Dashboards for Your Company | Ways You ...
- PM Dashboards | A KPI Dashboard | Sales KPI Dashboards |
- Visualize Sales Data Using Sample Data | A KPI Dashboard ...
- Sales Dashboard Template | Sales KPI ... - Conceptdraw.com
- A KPI Dashboard | Sales KPI Dashboards | A ... - Conceptdraw.com
- PM Dashboards | Meter Dashboard | A KPI Dashboard |
- Sales Dashboard | Sales Dashboard Examples | Visualize Sales ...
- PM Dashboards | What is a Dashboard Area | Sales KPI Dashboards |
- Sales Dashboard | Swot Analysis Examples | Sales KPIs - Dashboard |
- A KPI Dashboard Provides the Answers Your Sales Team | Sales ...