EPC Diagrams Illustrate Business Process Work Flows
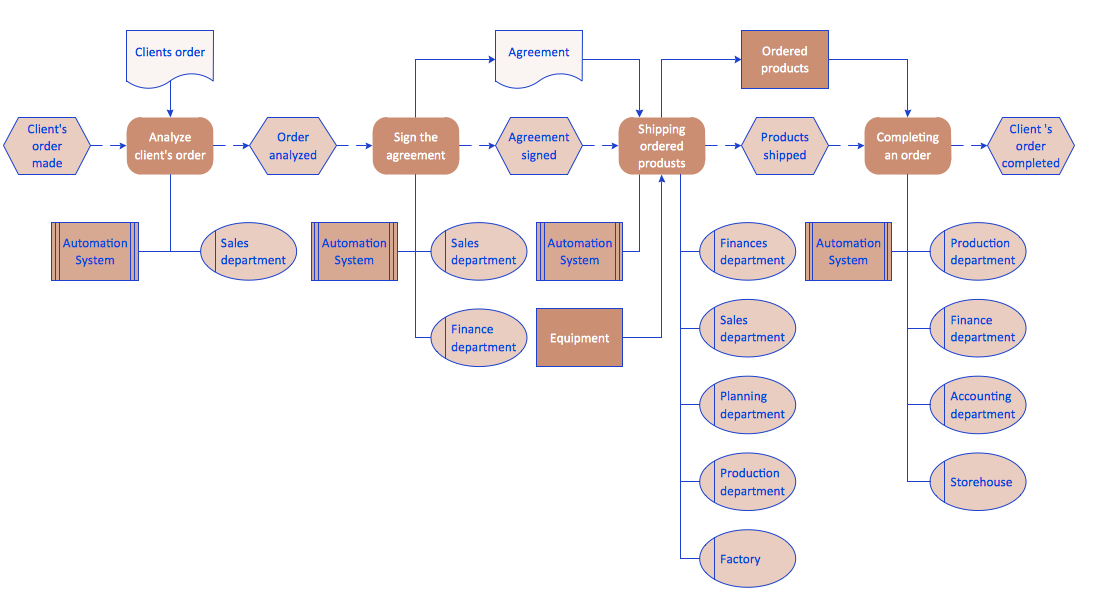
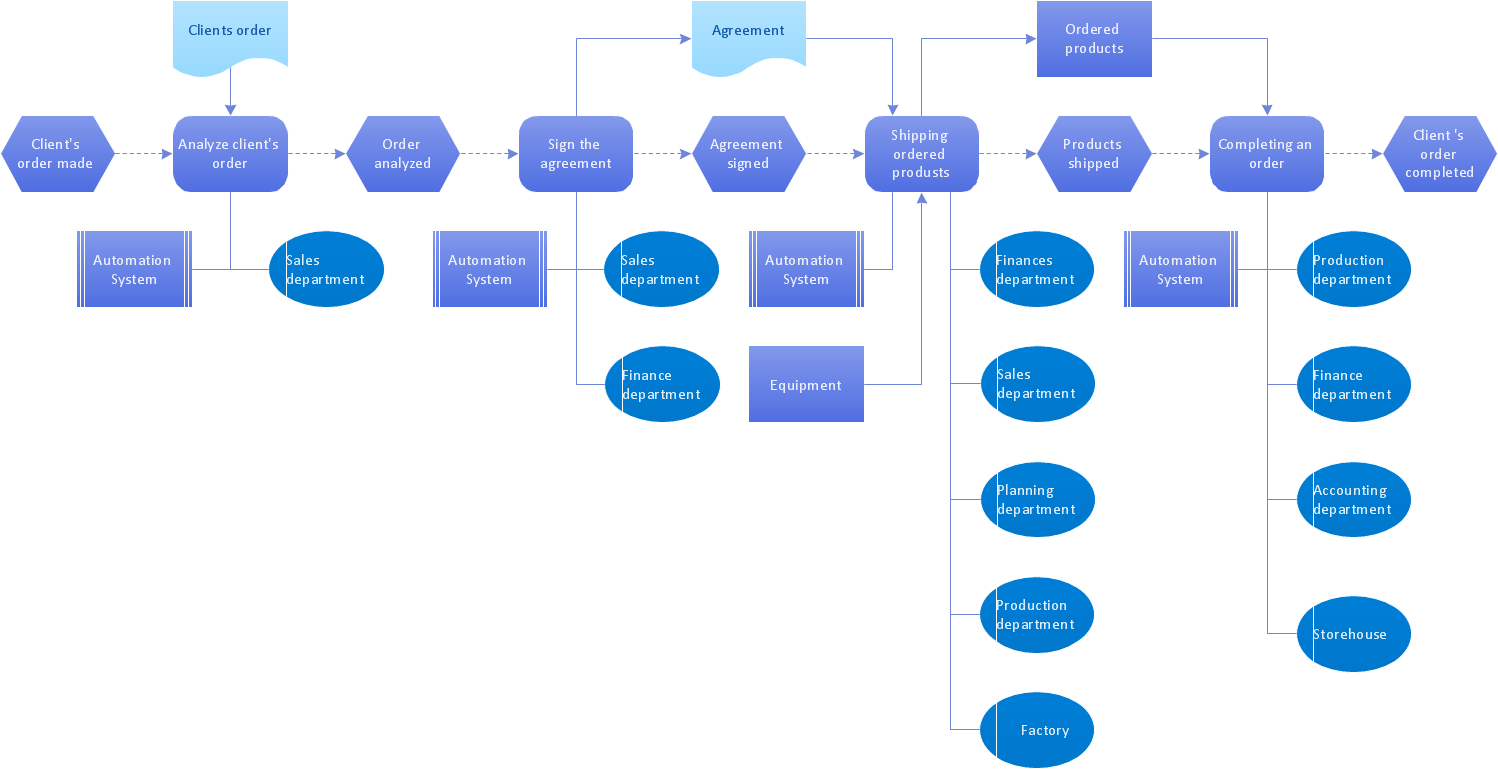
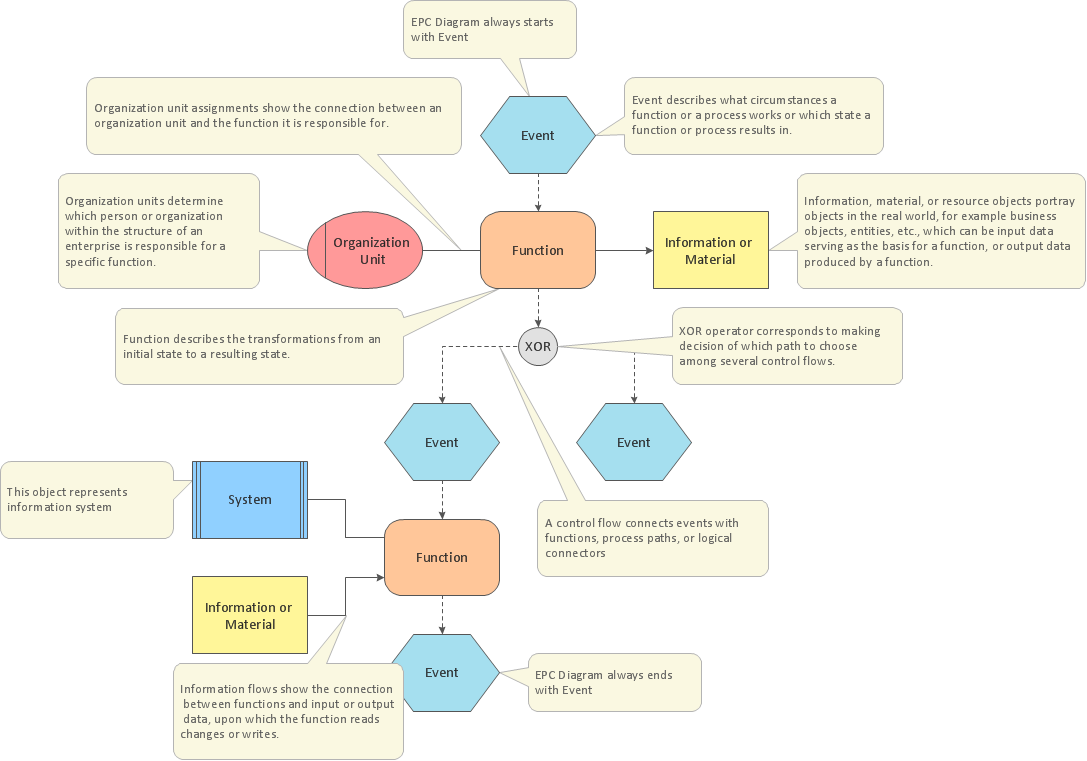
The Event-driven Process Chain ( EPC ) Diagrams allows users present business process models in terms of work flows. The EPC diagram can show various ways for improvement throughout an organisation.EPC - Business Processes in Terms of Work Flows
The Event-driven Process Chain ( EPC ) Diagrams allows users to present business process models in terms of work flows.The EPC diagram can shows various vayes how to reach positive company performance.
EPC for Business Process Improvement
ConceptDraw PRO - software that reduces the time needed to create a business process model.ConceptDraw PRO for making EPC diagrams provides business improvement . The Event-driven Process Chain ( EPC ) Diagrams allows reach improvement throughout an organisation.
Process Flowchart
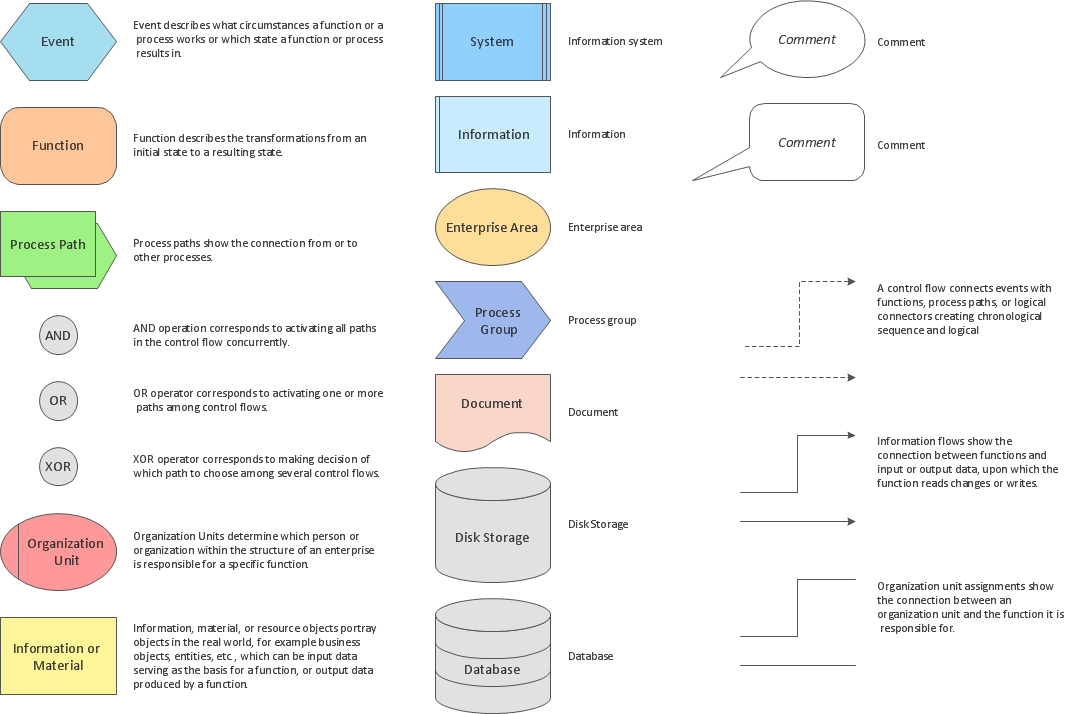
ConceptDraw is Professional business process mapping software for making process flow diagram, workflow diagram, general flowcharts and technical illustrations for business documents. It is includes rich examples, templates, process flowchart symbols. ConceptDraw flowchart maker allows you to easier create a process flowchart. Use a variety of drawing tools, smart connectors, flowchart symbols and shape libraries to create flowcharts of complex processes, process flow diagrams, procedures and information exchange.
Business Process Workflow Diagram
Business Process Workflow Diagram is a professional visual tool that is widely applied for business development, business analysis, business process optimization and documenting business processes. Business Process Workflow Diagram lets depict in details the steps of business processes and flow of tasks between them, the execution of business processes, transfer of data and documents.The workflows on the Business Process Workflow Diagram are represented using the set of common symbols which let easy illustrate business processes and process flows, depict the start, all major steps and end of the process, what data are used by the process, how the data flow through the business areas within scope of our project, how the tasks are executed and by who, and how workers interact with each other.

EPC for Business Process Implementation
Event-Driven Process Chain Diagrams for improvement throughout an organisation.ConceptDraw PRO - software that reduces the time needed to create a business process model.
Software for Drawing EPC Diagrams
Event-Driven Process chain Diagrams for improvement throughout an organisation.ConceptDraw PRO - software that reduces the time needed to create a business process model.
ConceptDraw Arrows10 Technology
When you are connecting existing objects you can control the diagram structure by changing selection order.This is how diagramming software should work. You are able to draw a diagram as quickly as the ideas come to you.
Flowchart
With ConceptDraw PRO it is easy to create professional flowchart diagrams of any complexity. With the use of numerous templates and the extensive libraries of ready-made symbols and blocks; depicting your business processes has never been easier.Venn Diagram Examples for Problem Solving. Venn Diagram as a Truth Table
Venn diagrams are illustrations used in the branch of mathematics known as set theory. They show the mathematical or logical relationship between different groups of things (sets). A Venn diagram shows all the possible logical relations between the sets.Business and Finance Illustrations Example
ConceptDraw Business Finance Illustration examples and libraries contain vector clip art for drawing different Business and Finance Illustrations. You may find Advertising example, Project Management example, Business Model example and many more.How can you illustrate the weather condition
Use it to make professional looking documents, presentations, and websites illustrated with color scalable vector clipart for geography, weather, and animals.Business People Figures
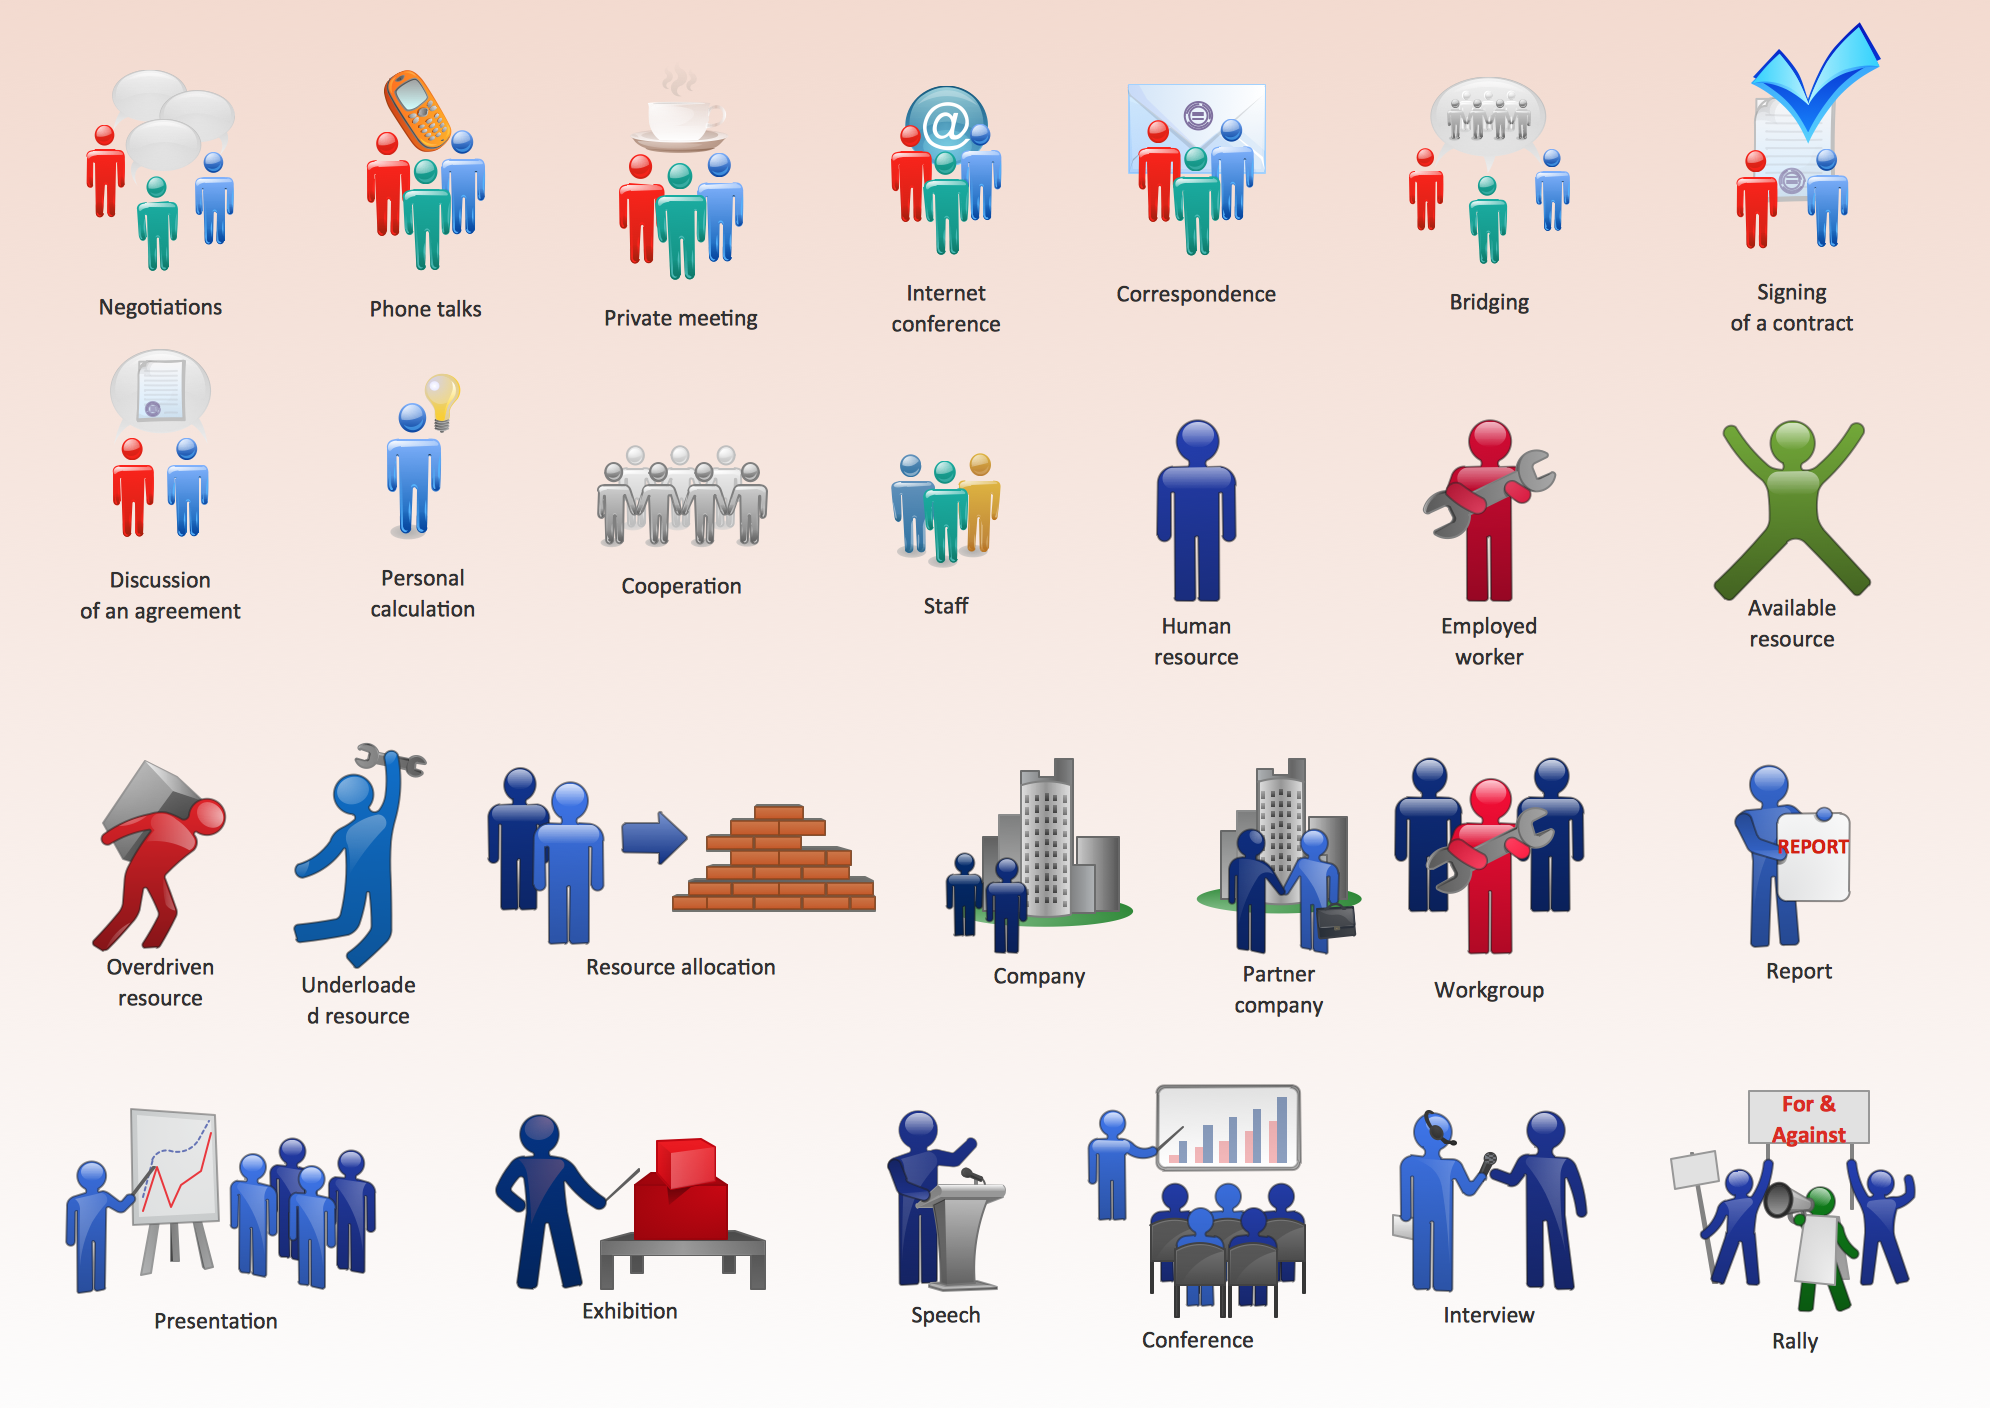
Nowdays business people’s figures are most favourite vector illustrations among presenters and designers. It is easy to make them and use, but they can make your graphics look really good looking & eye catching.Just check ConceptDraw business perople figusers pictures, you will see all kinds of silhouetes: Staff, Employed workers, Persons and Groups symbols.
Best popular vector pictures are: men, dancing people, business man.
Use human contours wise and it will help you to tell main idea of your design message.
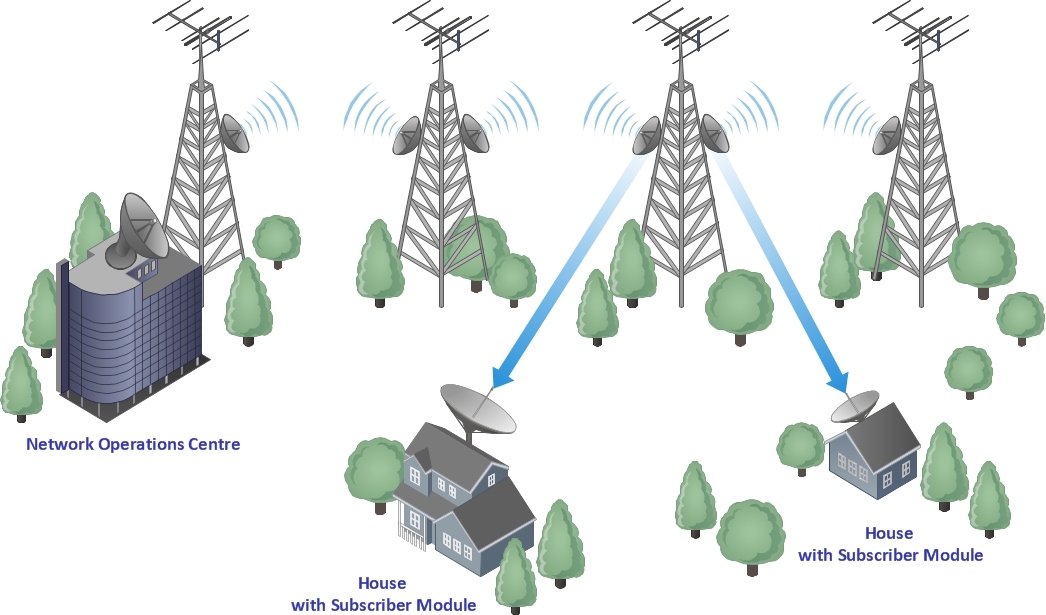
Illustrate the Computer Network of a Building
With best content of the Wireless Network solution that includes more than 10 building pre-designed objects network engineers can illustrate the computer network of a building.Venn Diagram Examples for Problem Solving. Environmental Social Science. Human Sustainability Confluence
The Venn diagram example below shows sustainable development at the confluence of three constituent parts.Create your Venn diagrams for problem solving in environmental social science using the ConceptDraw PRO diagramming and vector drawing software extended with the Venn Diagrams solution from the area "Diagrams" of ConceptDraw Solution Park.
- EPC Diagrams Illustrate Business Process Work Flows | Business ...
- Graph Illustrate Business Management
- EPC Diagrams Illustrate Business Process Work Flows | Websites ...
- EPC for Business Process Improvement | EPC Diagrams Illustrate ...
- EPC Diagrams Illustrate Business Process Work Flows | EPC ...
- EPC Diagrams Illustrate Business Process Work Flows | Event ...
- Event-driven Process Chain (EPC) Diagrams | EPC Diagrams ...
- EPC - Business Processes in Terms of Work Flows | EPC Diagrams ...
- Event-driven Process Chain Diagrams | EPC Diagrams Illustrate ...
- Order processing - EPC flow chart | EPC Diagrams Illustrate ...
- Process Flowchart | How to Add a Workflow Diagram to a ...
- EPC - Business Processes in Terms of Work Flows | Work Flow ...
- EPC Diagrams Illustrate Business Process Work Flows
- Illustrate Steps
- Process Flowchart | Types of Flowcharts | Business Process ...
- How can you illustrate the weather condition | Affinity diagram ...
- Process Flowchart | Types of Flowcharts | Business Process ...
- How can you illustrate the weather condition | Aerospace - Design ...
- Illustrate the Computer Network of a Building | Top iPad Business ...
- How to Draw a Good Diagram of a Business Workflow? | Hiring ...
- ERD | Entity Relationship Diagrams, ERD Software for Mac and Win
- Flowchart | Basic Flowchart Symbols and Meaning
- Flowchart | Flowchart Design - Symbols, Shapes, Stencils and Icons
- Flowchart | Flow Chart Symbols
- Electrical | Electrical Drawing - Wiring and Circuits Schematics
- Flowchart | Common Flowchart Symbols
- Flowchart | Common Flowchart Symbols
