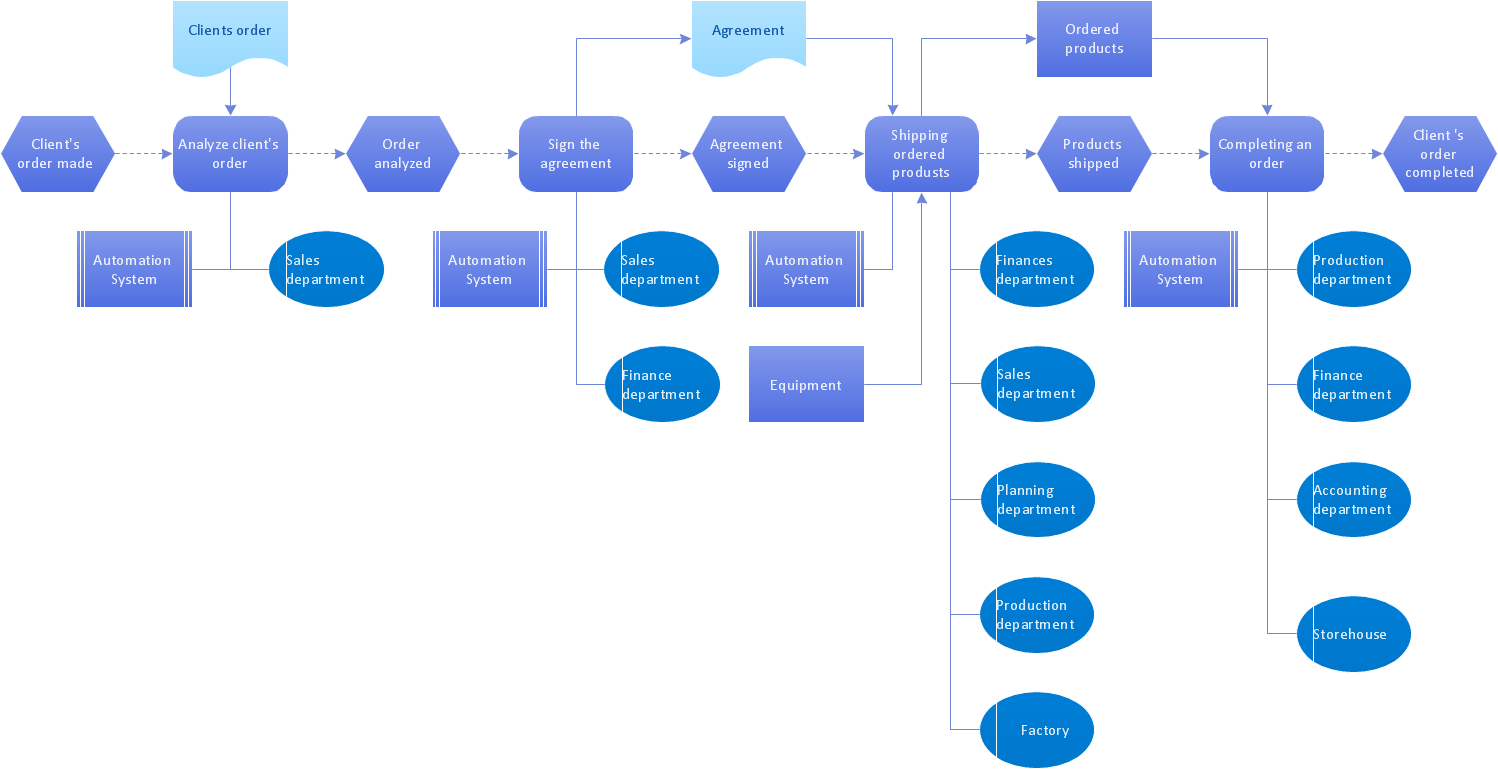
Pic.1 Order processing - EPC diagram.
The Event-driven Process Chain Diagrams solution extends ConceptDraw DIAGRAM software with EPC templates, samples, and vector shape library for the drawing of EPC diagrams.
The Event-driven Chain Diagrams solution assists in the planning of resources and improves business processes using EPC flowcharts.
TEN RELATED HOW TO's:
Design efficiently the technical flow charts in ConceptDraw DIAGRAM software for various fields and provide ✔️ clarity, ✔️ accuracy, ✔️ usability, ✔️ simple communication, analysis, and improvement
Picture: Technical Flow Chart Example
Related Solution:
A flowchart is a simple but very functional tool when it comes to understanding a workflow or to removing unnecessary stages from a process. When drawing flowcharts, keep in mind that there are four common types of flowcharts, like document flowcharts and data flowcharts that show control over a data or document flow over a system. To show controls on a physical level, use system flowcharts. In addition, to show controls in a program, you can draw a program flowchart.
This flowchart diagram represents the piece of an article editing process, that involves the author and editor. It was created using the Basic Flowchart notation that consists from the basic flowchart symbols. The start and the end of the process are indicated with "Terminator" symbols. The "Process" symbols show the action steps consisting from making edits and searching for a compromise, when the author does not agree with the suggestions of the editor. The "Process" symbol is the general symbol in process flowcharts. The "Decision" symbol indicates a branching in the process flow. There are two branches indicated by a Decision shape in the current flowchart (Yes/No, Disagree/Agree). This basic flowchart can be used as a repeating unit in the workflow diagram describing the working process of some editorial office.
Picture: Types of Flowcharts
Related Solution:
Create your own flow charts of purchasing business processes using the ConceptDraw DIAGRAM software
Picture:
Purchasing Flowchart - Purchase Order
Flowchart Examples
Related Solution:
Credit Card Processing System UML Diagram. This sample shows the Use Case Diagram of the credit card processing system. You can see how the payment by credit card occurs. This sample can be used by the bank, financial enterprises, for understanding the work of the credit card processing system at the projecting the banking systems.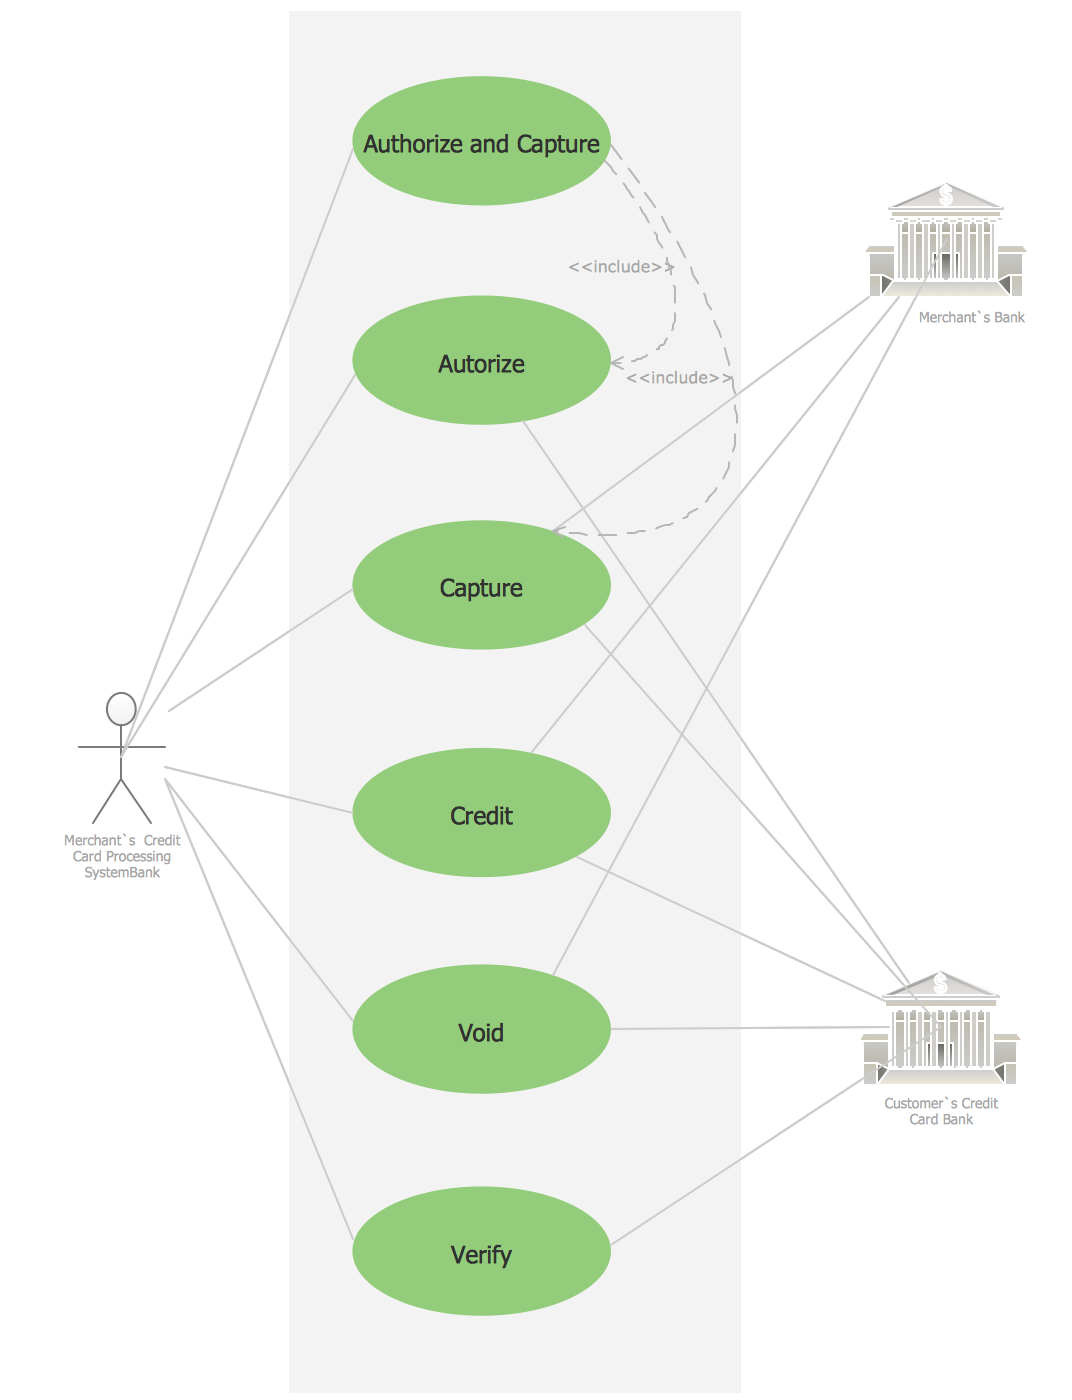
Picture: Credit Card Processing System UML Diagram
Related Solution:
Constant improvement of key performance indicators that are related to quality is a step in the right direction for a company interested in market growth.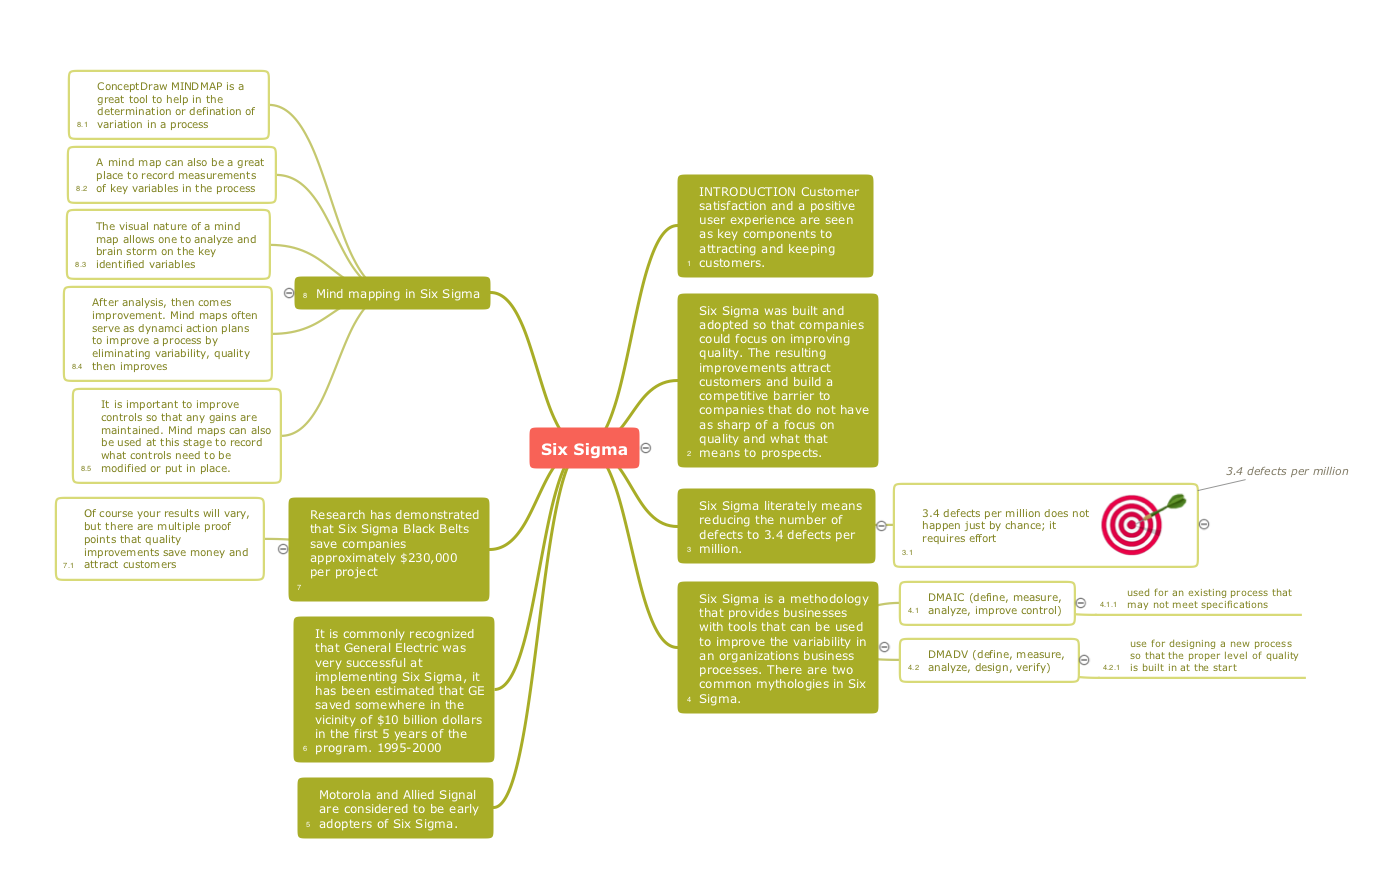
Picture: Quality Improvement
Related Solution:
The Event-driven Process Chain ( EPC ) Diagrams allows users present business process models in terms of work flows. The EPC diagram can show various ways for improvement throughout an organisation.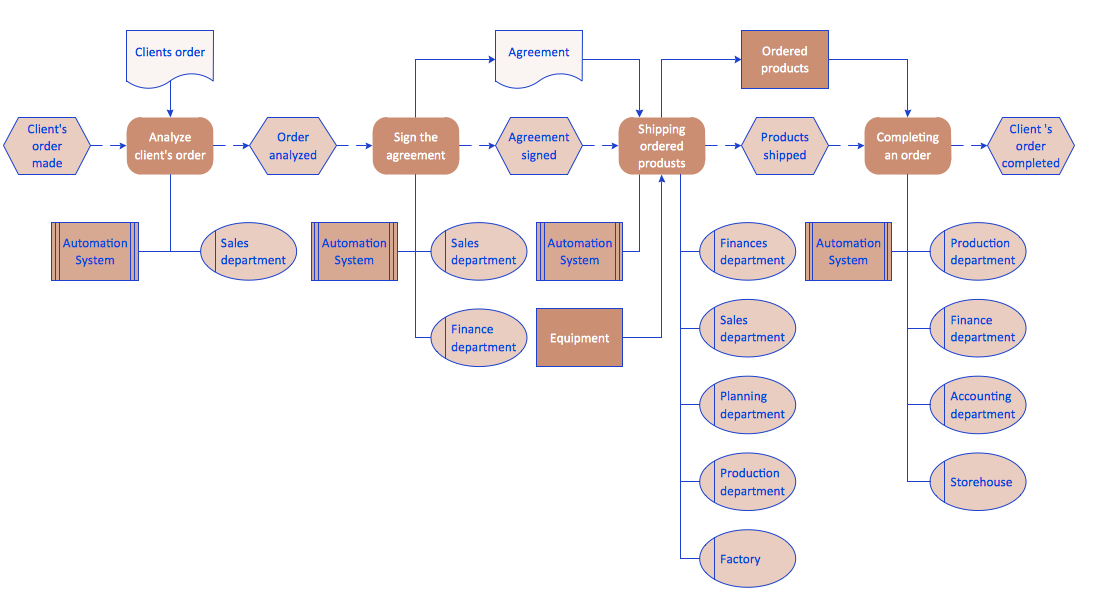
Picture: EPC Diagrams Illustrate Business Process Work Flows
Related Solution:
Accounting flowchart is a system of processes to represent accounting system of an organization. If you need to know how accounting processes work and how each operation is done, the Accounting Flowcharts Solution for ConceptDraw DIAGRAM has a predesigned library, tips, methods and symbols for easy drawing an Accounting Flowchart.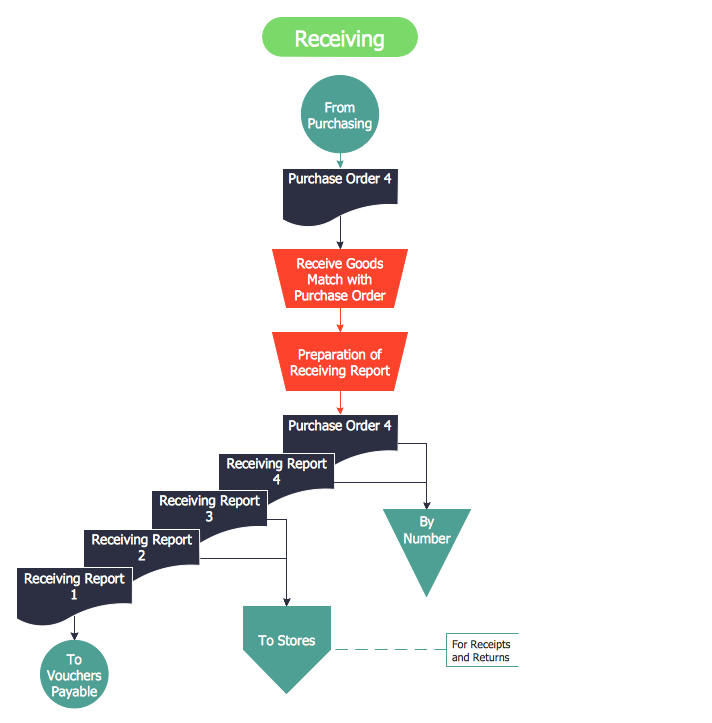
Picture: Accounting Flowchart
Related Solution:
Any business process consists from a number of tasks carrying out the certain business goal. It is useful to diagram business processes to ensure that they are as foolproof, logical and sequential as possible. This business process diagram describes a typical booking process flow by the example of a cab booking process. It can be used as a roadmap for any booking system implementation. Diagramming a business process allows you to look at the entire project and take into account all types of possible scenarios. Business process diagram helps you investigate and clarify the process thoroughly so that you can find out how it can be improved. Business process diagram supports team communications by ensuring that each process element is clear and everyone in the team is on the same page.
Sometimes your company brings you less profit than you expect it to be, and it’s difficult to reveal the causes. Maybe it’s time to learn new technologies, because business diagram are easily developed by means of special software, so you won’t make any extra effort. In return, you will increase your productivity and get more done in a less time.
Picture: Business Diagram Software
Related Solutions:
Business process maps help you evaluate and manage quality in a work process chain, placing an emphasis on corporate performance and optimization.
Business Mapping Software a versatile collection of libraries and templates, that allow you to create business process and SIPOC diagrams, using the Six Sigma methodology.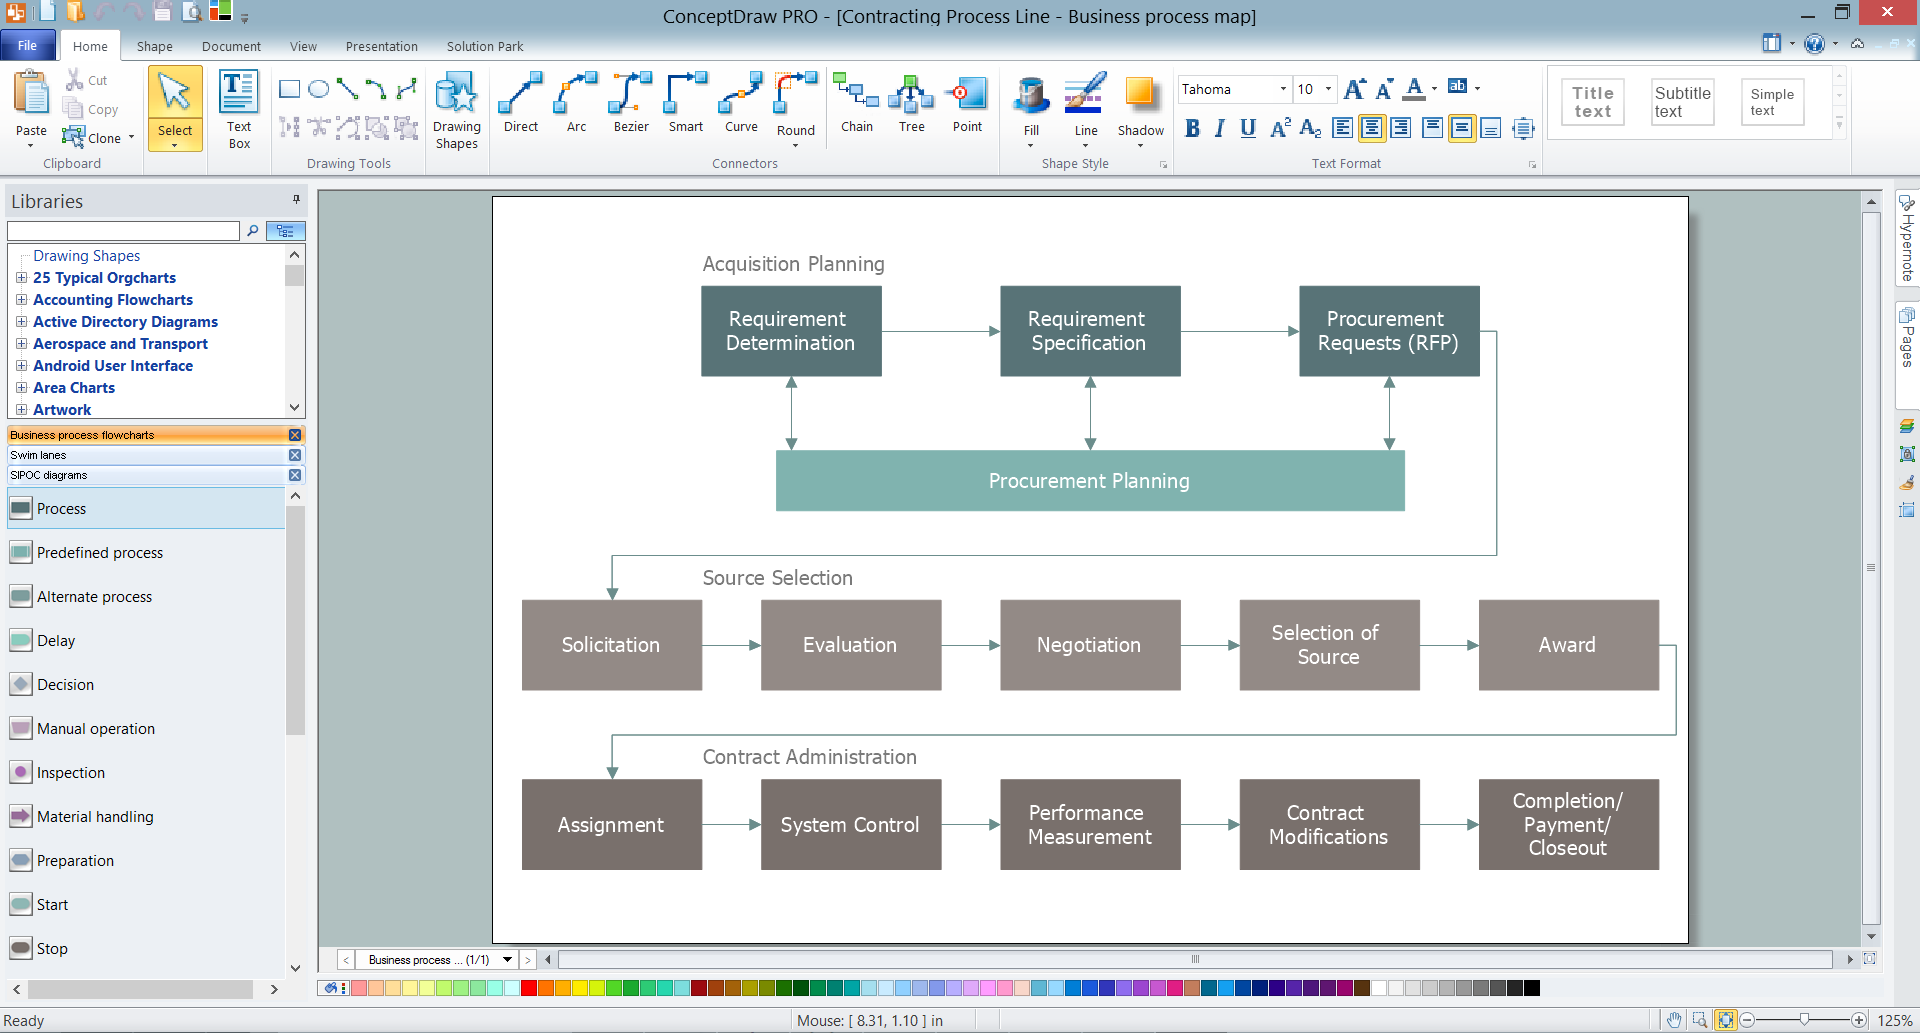
Picture: Business Mapping Software
Related Solution:
ConceptDraw DIAGRAM software is the best Mac software for drawing workflow diagrams. Its rich set of samples and templates, and specific features to draw diagrams faster make this software as comfortable as possible for drawing workflow diagrams.
Use the ConceptDraw DIAGRAM professional Mac OS X software for drawing workflow diagram. The Workflow Diagrams solution with its libraries and templates set make the possibility to identify resources that are required for work goal implementation. The process flow diagram identify flow which occurs as network of process dependencies, organizational decisions and interactions between departments. Usually workflow diagrams show business participants actions that carry product or service to the final destination, the consumer.
Picture: Workflow Diagram Software Mac
Related Solution: