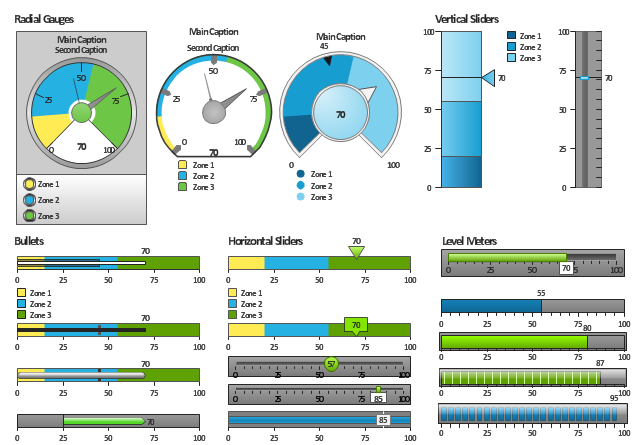
The vector stencils library "Meter indicators 2" contains 29 Live Objects: speedometer gauge, dial, bullet graph, slider and level meter visual indicators.
The Live Objects designed to display actual measures of performance metrics and KPIs from external data source files.
Some of them also display comparative measures, and colored zones of qualitative ranges with legend.
Use it to draw business performance dashboards using the ConceptDraw PRO diagramming and vector drawing software .
"A performance indicator or key performance indicator (KPI) is a type of performance measurement. An organization may use KPIs to evaluate its success, or to evaluate the success of a particular activity in which it is engaged. Sometimes success is defined in terms of making progress toward strategic goals, but often success is simply the repeated, periodic achievement of some level of operational goal. Accordingly, choosing the right KPIs relies upon a good understanding of what is important to the organization. 'What is important' often depends on the department measuring the performance - e.g. the KPIs useful to finance will be quite different from the KPIs assigned to sales. Since there is a need to understand well what is important (to an organization), various techniques to assess the present state of the business, and its key activities, are associated with the selection of performance indicators. These assessments often lead to the identification of potential improvements, so performance indicators are routinely associated with 'performance improvement' initiatives. A very common way to choose KPIs is to apply a management framework such as the balanced scorecard." [Performance indicator. Wikipedia]
The example "Design elements - Meter indicators" is included in the Meter Dashboard solution from the area "What is a Dashboard" of ConceptDraw Solution Park.
 PM Dashboards
The PM Dashboards solution extends the management boundaries of ConceptDraw DIAGRAM and ConceptDraw PROJECT products with an ability to demonstrate changes to the budget status, to show the project progress toward its objectives, to display clearly the identified key performance indicator (KPI) or the set of key performance indicators for any project. This solution provides you with examples and ability to generate three types of visual dashboards reports based on your project data Project Dashboard, Tactical Dashboard, and Radar Chart. By dynamically charting the project’s key performance indicators that are collected on one ConceptDraw DIAGRAM document page, all project participants, project managers, team members, team leaders, stakeholders, and the entire organizations, for which this solution is intended, have access to the daily status of projects they are involved in.
How To Plan and Implement Projects Faster
ConceptDraw Office is the most effective tool for planning, tracking, and reporting all types of projects with strong management capabilities, user friendly functionality, and superior ease of use. In this tutorial video we will assist you in planning and managing a project using ConceptDraw Office.Critical Path Method in ConceptDraw PROJECT
The Critical Path Method (CPM) is an algorithm for scheduling a set of project activities. It is an important tool for effective project management. ConceptDraw PROJECT implements this method to provide the user with a wide set of project management tools.
 Meter Dashboard
Meter dashboard solution extends ConceptDraw DIAGRAM software with templates, samples and vector stencils library with meter indicators for drawing visual dashboards showing quantitative data.
Project — Assigning Resources
Users new to ConceptDraw PROJECT will find the Basic lessons an essential platform for familiarizing themselves with the program′s functions. Learn how to assign resources to tasks in ConceptDraw PROJECT with this comprehensive video lesson.
 Business Productivity Area
Business Productivity Solutions extend ConceptDraw products with tools for making presentations, conducting meetings, preparing documents, brainstorming, or building new strategies.
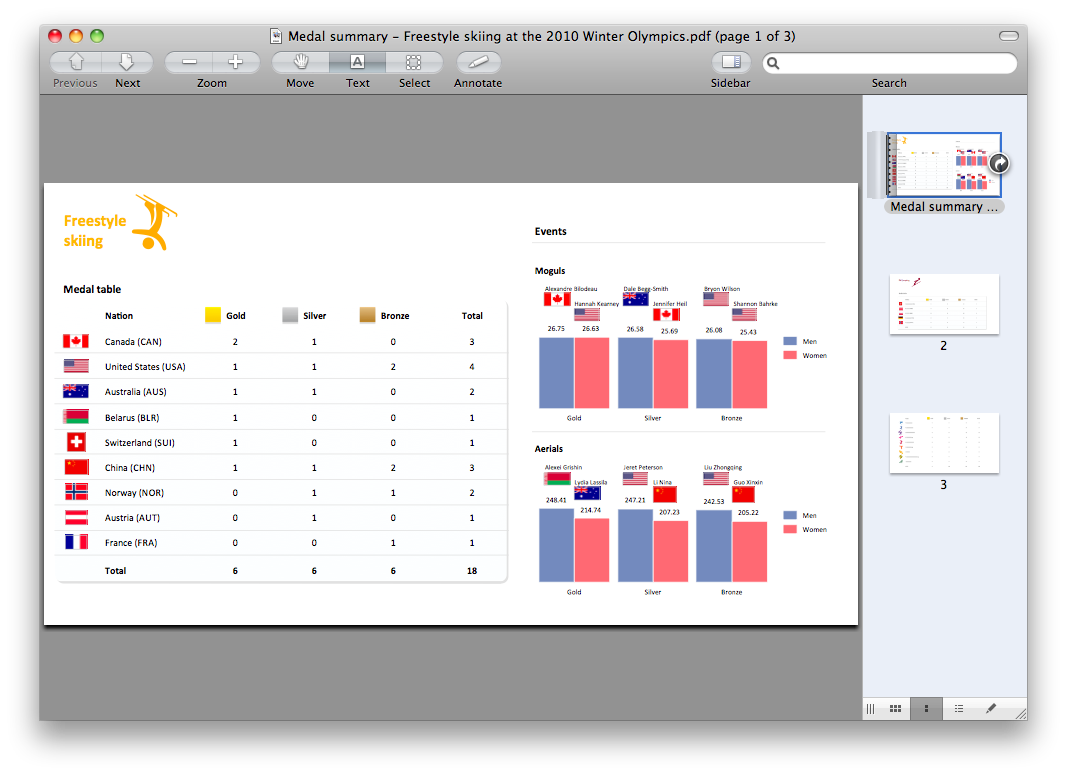
Export from ConceptDraw DIAGRAM Document to PDF (Adobe Acrobat®) File
ConceptDraw DIAGRAM has extensive export capabilities which allow you to export your drawing to Adobe PDF files. Thus, you can share your documents with your colleagues and friends even if they don't have ConceptDraw DIAGRAM installed on their computer.
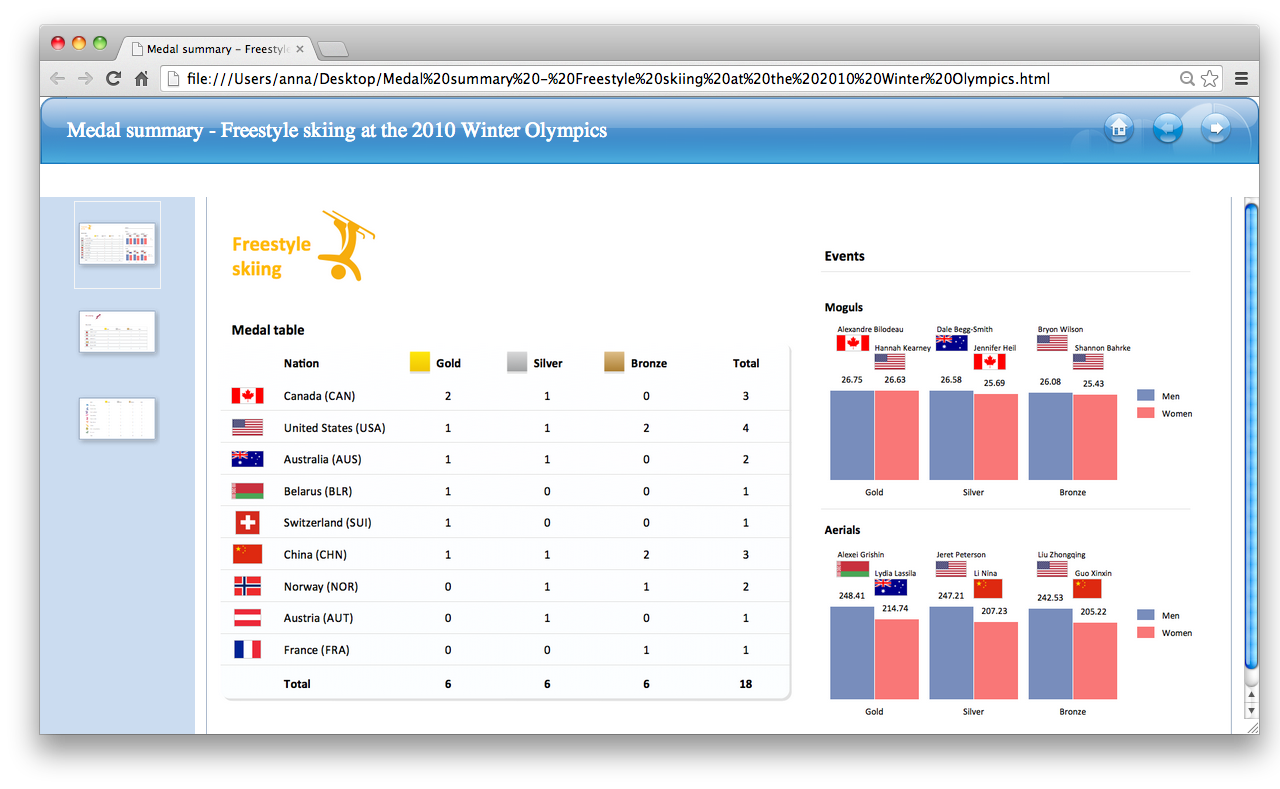
Export from ConceptDraw DIAGRAM Document to HTML
Using ConceptDraw DIAGRAM , you can save diagrams as a Web pages. ConceptDraw DIAGRAM adds the HTML tags that are needed to display your diagrams in a Web browser, so all you have to do is design their appearance.
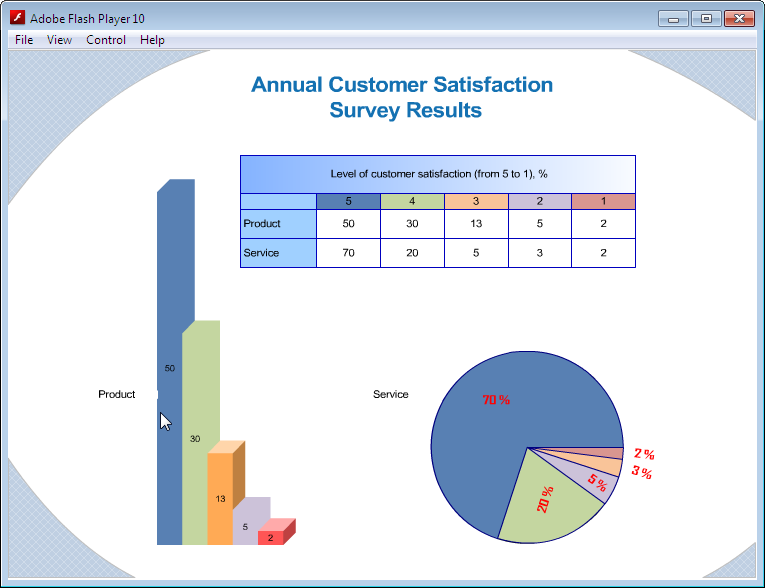
Export from ConceptDraw DIAGRAM Document to SWF (Adobe® Flash®) File
ConceptDraw DIAGRAM ’s has extensive export capabilities which allow you to export your drawing as MS PowerPoint® and Adobe PDF files. You can also embed a drawing into an HTML page after saving it in SWF or SVG formats.
Export from ConceptDraw DIAGRAM Document to a Graphic File
Now it’s easy to share your visual documents with other people in a form most convenient for them. ConceptDraw DIAGRAM can save your drawings and diagrams in a number of highly useful formats, including graphic files. You can save your drawing as a.PNG,.JPG, or other graphic format file.
Export from ConceptDraw DIAGRAM Document to PPT or PPTX (MS PowerPoint®) File
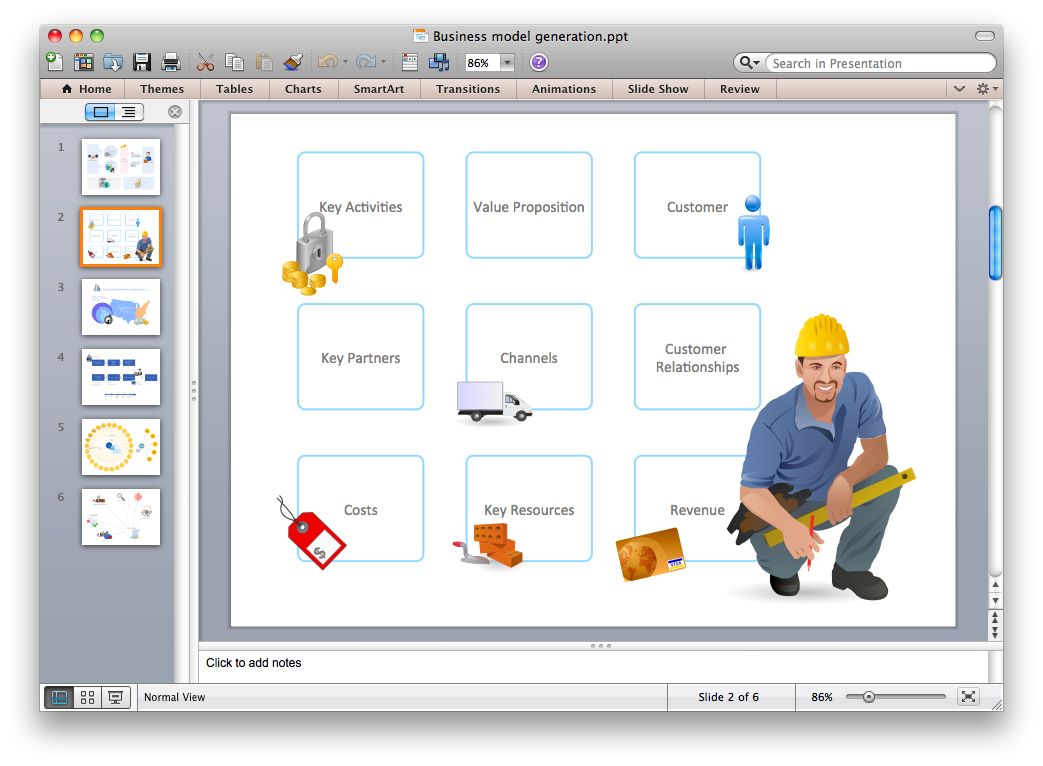
ConceptDraw DIAGRAM has extensive export capabilities which allow you to export your drawing to
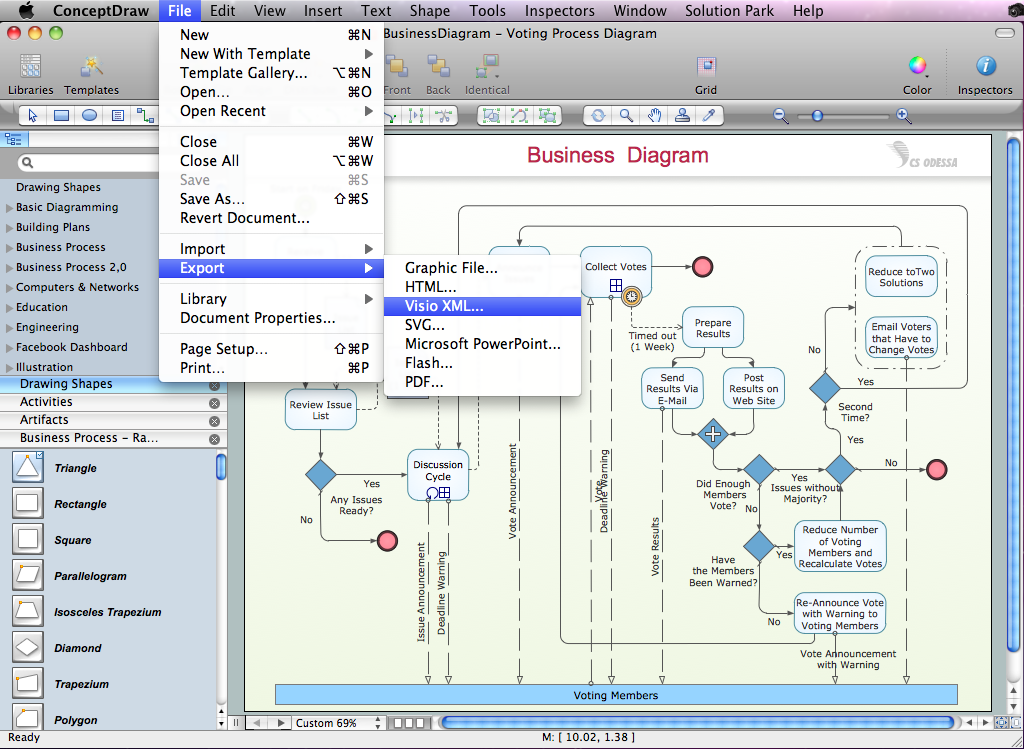
Export from ConceptDraw DIAGRAM Document to MS Visio® XML
Once you have created your document in ConceptDraw DIAGRAM and you want to share it with your colleagues and friends, who uses MS Visio on their computers, you can easily export your document using ConceptDraw DIAGRAM export to Visio XML files (VDX) feature. Now you can share your ConceptDraw documents with MS Visio users.
Comparing ConceptDraw DIAGRAM to Omnigraffle
Comparing ConceptDraw DIAGRAM to Omnigraffle you can see a lot of benefits of ConceptDraw products. First, the main, ConceptDraw applications are cross-platform and available in two independent and concurrent versions for Macintosh (macOS) and PC (Windows). ConceptDraw gives you the per named license, that you can use simultaneously for your both Macintosh and PC, at work and at home. Free access to the ConceptDraw Solution Park offers you the great number of solutions with hundreds of templates and samples, and thousands of ready-to-use vector objects for quick and easy creation diagrams, drawings, illustrations and Mind Maps. Besides, thanks to Ingyre Technology is provided the integration with Microsoft Office applications and capabilities of limitless exchange the information. The ConceptDraw Live Objects technology lets you design the visual dynamically-updated dashboards, the Rapid Draw technology allows creating the diagrams in minutes. The extensive presentation capabilities help you create lush and beautiful presentation slideshows from your ConceptDraw documents.ConceptDraw DIAGRAM : Able to Leap Tall Buildings in a Single Bound
ConceptDraw DIAGRAM is the world’s premier cross-platform business-diagramming tool. Many, who are looking for an alternative to Visio, are pleasantly surprised with how well they can integrate ConceptDraw DIAGRAM into their existing processes. With tens of thousands of template objects, and an easy method for importing vital custom objects from existing Visio documents, ConceptDraw DIAGRAM is a powerful tool for making extremely detailed diagrams, quickly and easily.Business Diagram Software
When managing the projects, people, or networks, there are daily designed and used different types of Business diagrams, so the powerful drawing software will be very useful for this. ConceptDraw DIAGRAM with large quantity of business solutions will meet your needs and will help you convey your ideas successful and rapidly, no matter are you professional or beginner. It is the best choice for business specialists and technical professionals who need quickly and easily explore, visualize, and communicate information. ConceptDraw DIAGRAM business diagram software is the most powerful business software and relational charting software. Create advanced, completely customizable Business Process Diagrams, Business Flow Charts, Work Flow Diagrams, Organizational Charts, Audit diagrams, Marketing diagrams, Value Stream Maps, TQM diagrams, ERD diagrams, EPC diagrams, Cause and Effect diagrams, Infographics, Dashboards, and other Relational business diagrams from your data using the powerful drawing tools of ConceptDraw Solution Park.
ConceptDraw DIAGRAM Export Capabilities
ConceptDraw DIAGRAM has the ability to export to a number of useful file formats, giving its users powerful flexibility when working with others.
- Business diagrams & Org Charts with ConceptDraw PRO | A KPI ...
- Sales Dashboard Template | Sales KPI Dashboards | Visualize ...
- A KPI Dashboard | A KPI Dashboard Provides the Answers Your ...
- TQM Diagram Tool | Marketing Diagrams | Sales KPI Dashboards |
- A KPI Dashboard Provides the Answers Your Sales Team | Sales ...
- TQM Diagram Tool | Marketing | Sales KPI Dashboards |
- A KPI Dashboard Provides the Answers Your ... - Conceptdraw .com
- Sales KPI Dashboards - Conceptdraw .com
- Meter Dashboard | Sales Dashboard | Website KPIs - Visual ...
- Sales KPI Dashboards - Conceptdraw .com
- Constant improvement of key performance indicators | A KPI ...
- Sales KPI Dashboards | A KPI Dashboard | KPIs ... - Conceptdraw .com
- A KPI Dashboard | Sales KPI Dashboards | A ... - Conceptdraw .com
- Sales KPI Dashboards
- A KPI Dashboard | A KPI Dashboard Provides ... - Conceptdraw .com
- Sales KPI Dashboards | A KPI Dashboard ... - Conceptdraw .com
- Sales KPI Dashboards | A KPI Dashboard ... - Conceptdraw .com
- A KPI Dashboard Provides the Answers Your Sales Team | Website ...
- Sales KPI Dashboards
- A KPI Dashboard Provides the Answers Your Sales Team | Visualize ...
