Export from ConceptDraw DIAGRAM Document
to PPT or PPTX (MS PowerPoint®) File
|
ConceptDraw DIAGRAM has extensive export capabilities which allow you to export your drawing to If you have a multipage document in ConceptDraw DIAGRAM it will be automatically converted to a .ppt or .pptx file with slides made of pages from your document. |
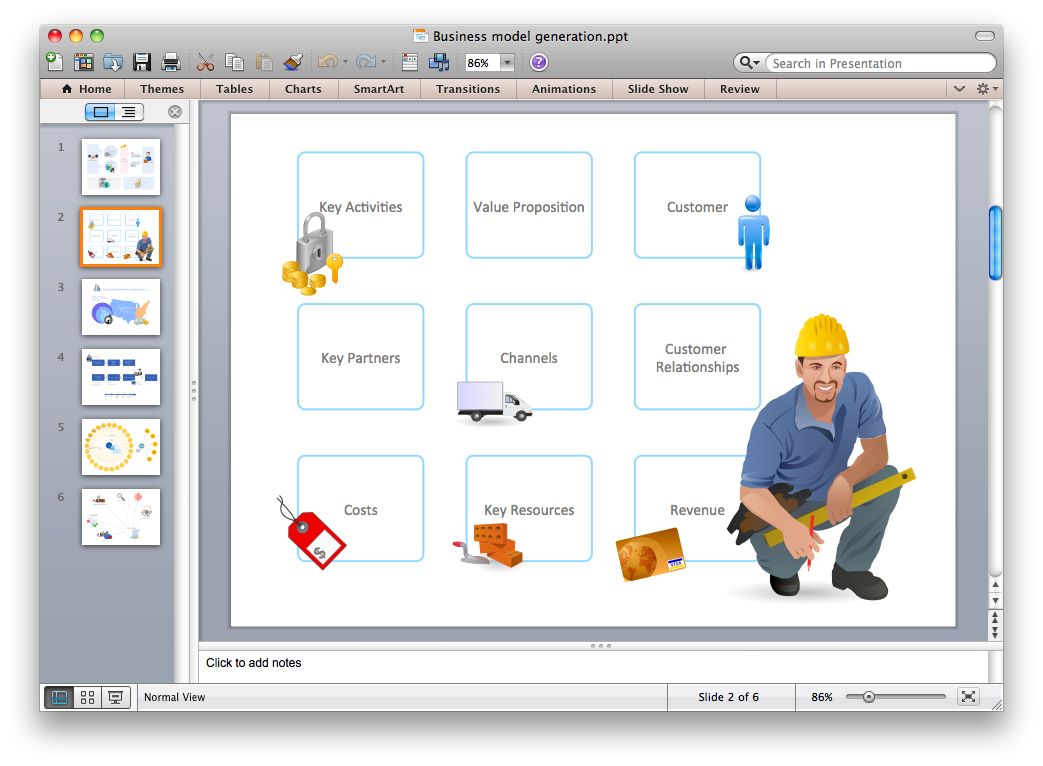
Pic. 1. A PowerPoint presentation file exported from a ConceptDraw DIAGRAM document.
There are no special settings required for this kind of export in CoceptDraw PRO, so you can create an
See also Samples:
- Business Process Diagrams
- Business Processes — Flow Charts
- Computer and Networks — Computer Network Diagrams
- Dashboards and KPI`s
- Fishbone Diagram
- Floor Plan and Landscape Design
TEN RELATED HOW TO's:
Accounting Data Flow from the Accounting Flowcharts Solution visually describes the financial accounting process, shows the accumulated information about transactions and events for creating the balance sheet and the final income statement.
Accounting Flowcharts Solution contains also a wide variety of templates and samples that you can use as the base for your own Accounting Flowcharts of any complexity.
Picture: Accounting Data Flow from the Accounting Flowcharts Solution
Related Solution:
ConceptDraw DIAGRAM diagramming and vector drawing software supplied with Chemical and Process Engineering Solution from the Industrial Engineering Area of ConceptDraw Solution Park is powerful and effective process engineering software.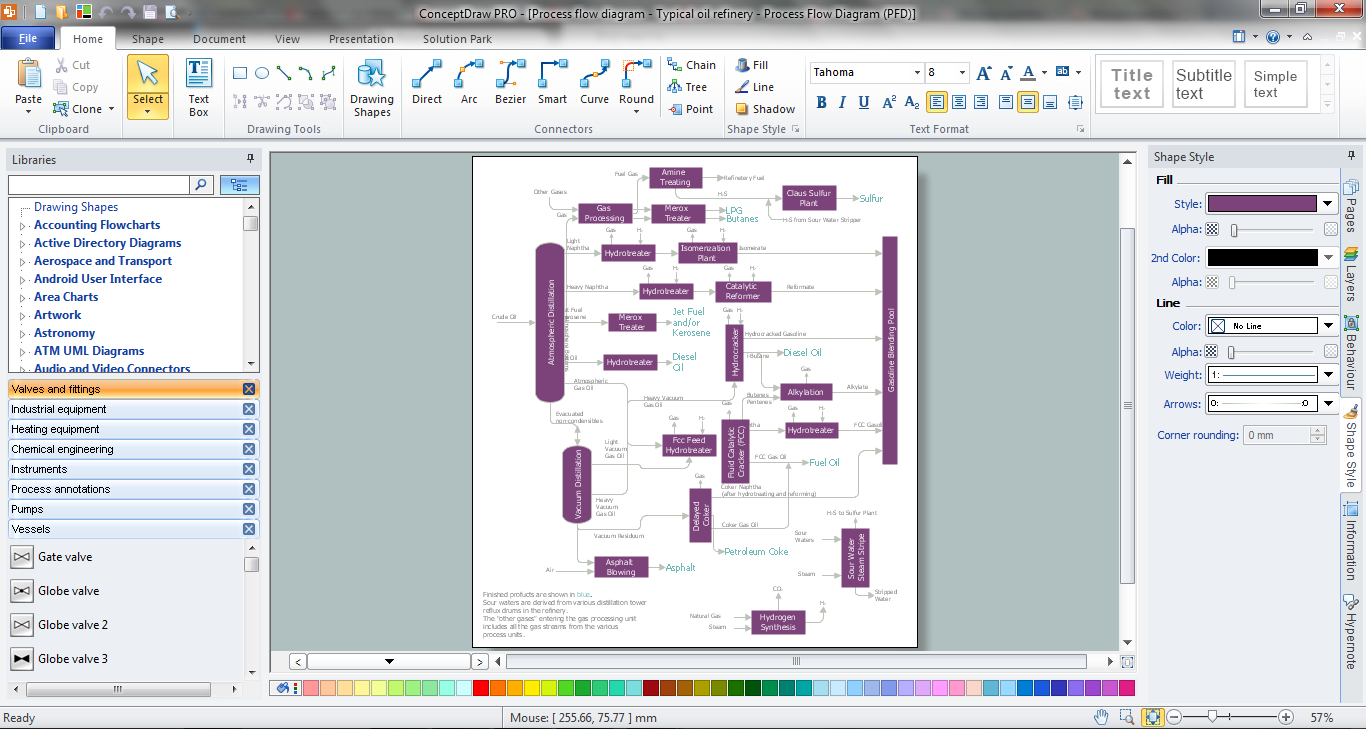
Picture: Process Engineering
Related Solution:
ConceptDraw MINDMAP the will guide you in creating and demonstrating powerful mind map presentations.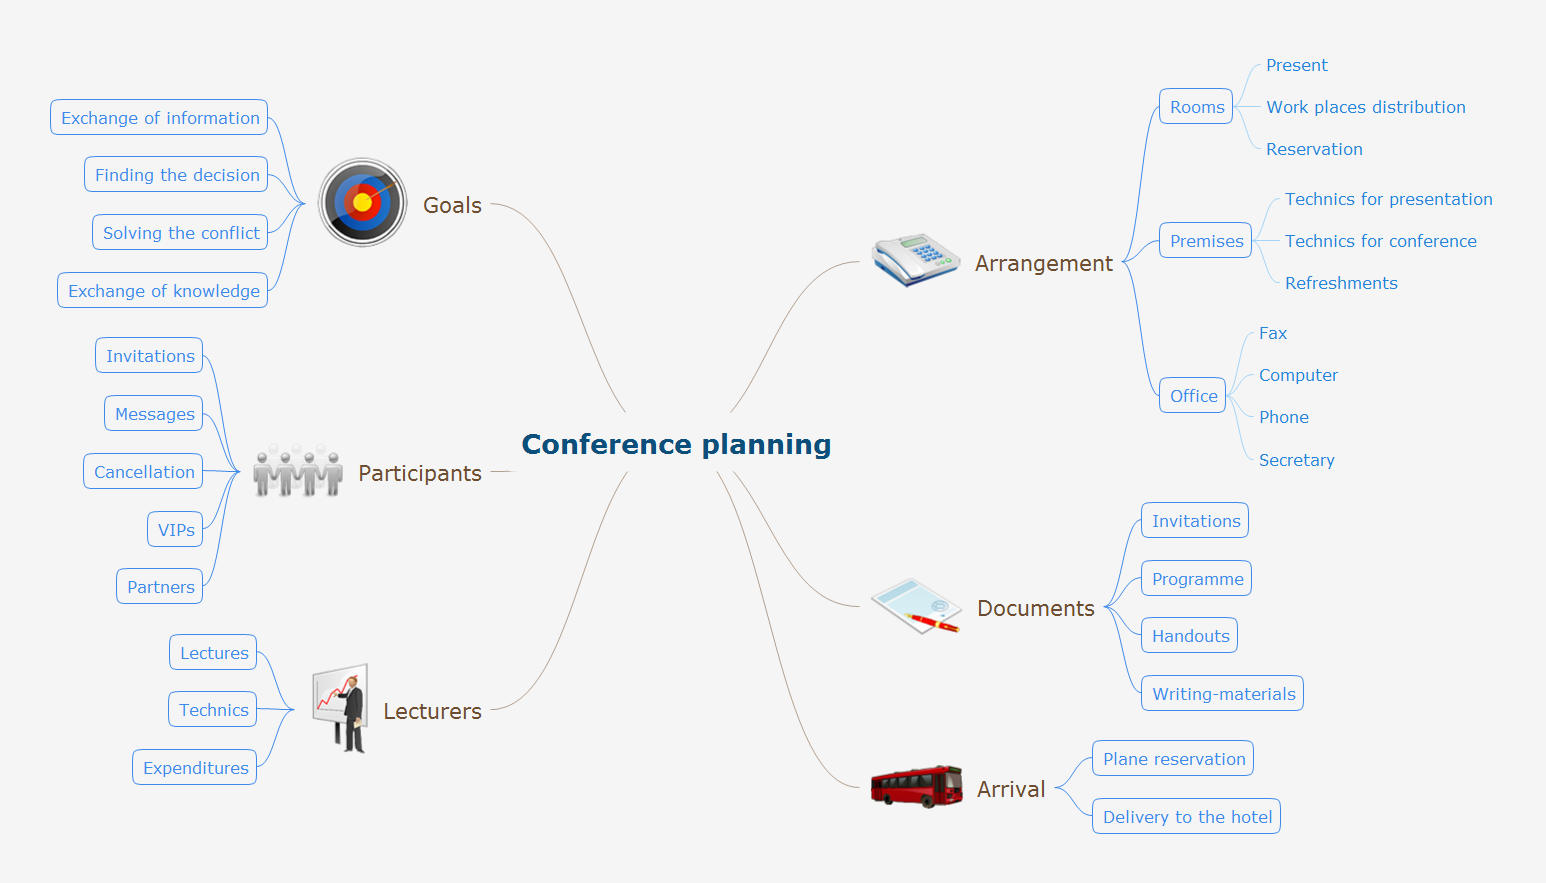
Picture: Program for Making Presentations
Related Solution:
Learning via presentations is used widely in education. This is a frequently used tool on trainings, especially for remote training via Skype.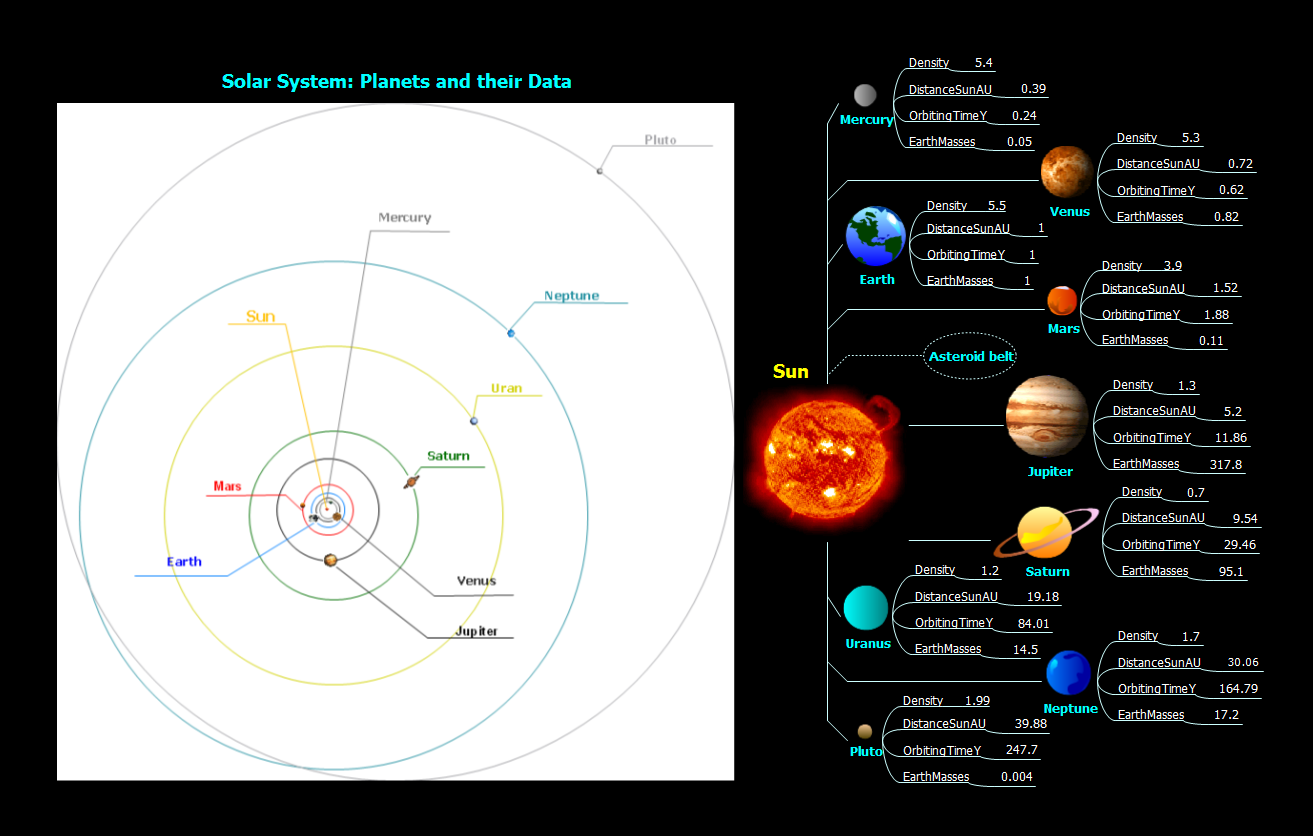
Picture: How To Create Presentation for Trainings and Learning process
Related Solution:
Create your own flow charts of settlement processes using the ConceptDraw DIAGRAM diagramming and vector drawing software extended with the Cross-Functional Flowcharts solution from the Business Processes area of ConceptDraw Solution Park.
Download easy flowchart software to create settlement process flowcharts show steps of monthly settlement with your business quickly and easily.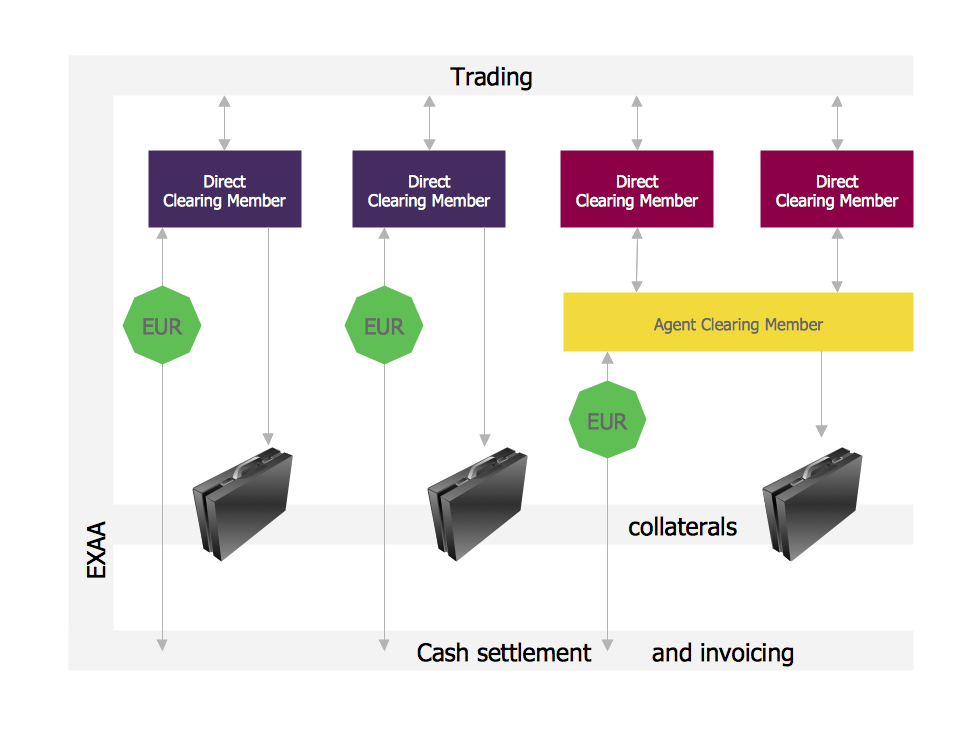
Picture: Settlement Process Flowchart. Flowchart Examples
Related Solution:
Mindmap Presentation. Present Mindmaps via Skype with ConceptDraw MINDMAP.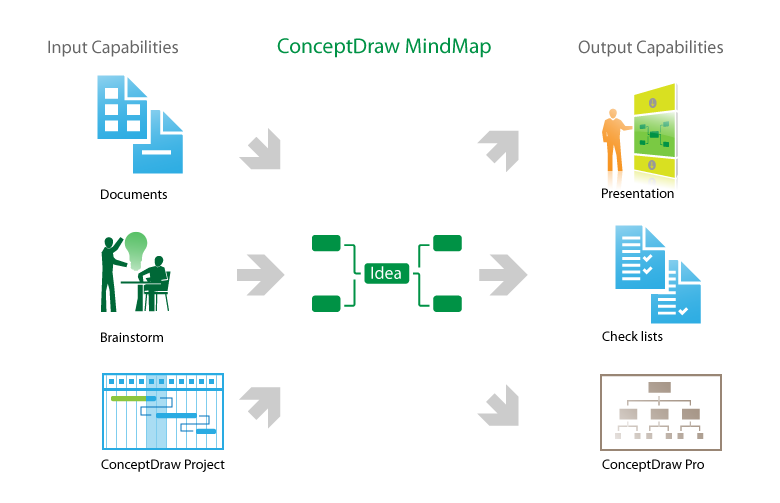
Picture: MindMap Presentation
Related Solution:
An advanced tool for creating presentations, if you decide to represent data without spending hours on that.
Picture: Best Software for Making Presentations
Related Solution:
While creating flowcharts and process flow diagrams, you should use special objects to define different statements, so anyone aware of flowcharts can get your scheme right. There is a short and an extended list of basic flowchart symbols and their meaning. Basic flowchart symbols include terminator objects, rectangles for describing steps of a process, diamonds representing appearing conditions and questions and parallelograms to show incoming data.
This diagram gives a general review of the standard symbols that are used when creating flowcharts and process flow diagrams. The practice of using a set of standard flowchart symbols was admitted in order to make flowcharts and other process flow diagrams created by any person properly understandable by other people. The flowchart symbols depict different kinds of actions and phases in a process. The sequence of the actions, and the relationships between them are shown by special lines and arrows. There are a large number of flowchart symbols. Which of them can be used in the particular diagram depends on its type. For instance, some symbols used in data flow diagrams usually are not used in the process flowcharts. Business process system use exactly these flowchart symbols.
Picture: Flowchart Symbols: Meaning and Examples
Related Solution:
ConceptDraw DIAGRAM has extensive export capabilities which allow you to export your drawing to MS PowerPoint file formats. So, you can create effective presentations right from your ConceptDraw DIAGRAM documents.
Picture: Export from ConceptDraw DIAGRAM Document to PPT or PPTX (MS PowerPoint®) File
Why to import PowerPoint slides into ConceptDraw MINDMAP ?
Picture: 3 Tips for a Killer Presentation
Related Solution:
ConceptDraw
DIAGRAM 18