 Value Stream Mapping
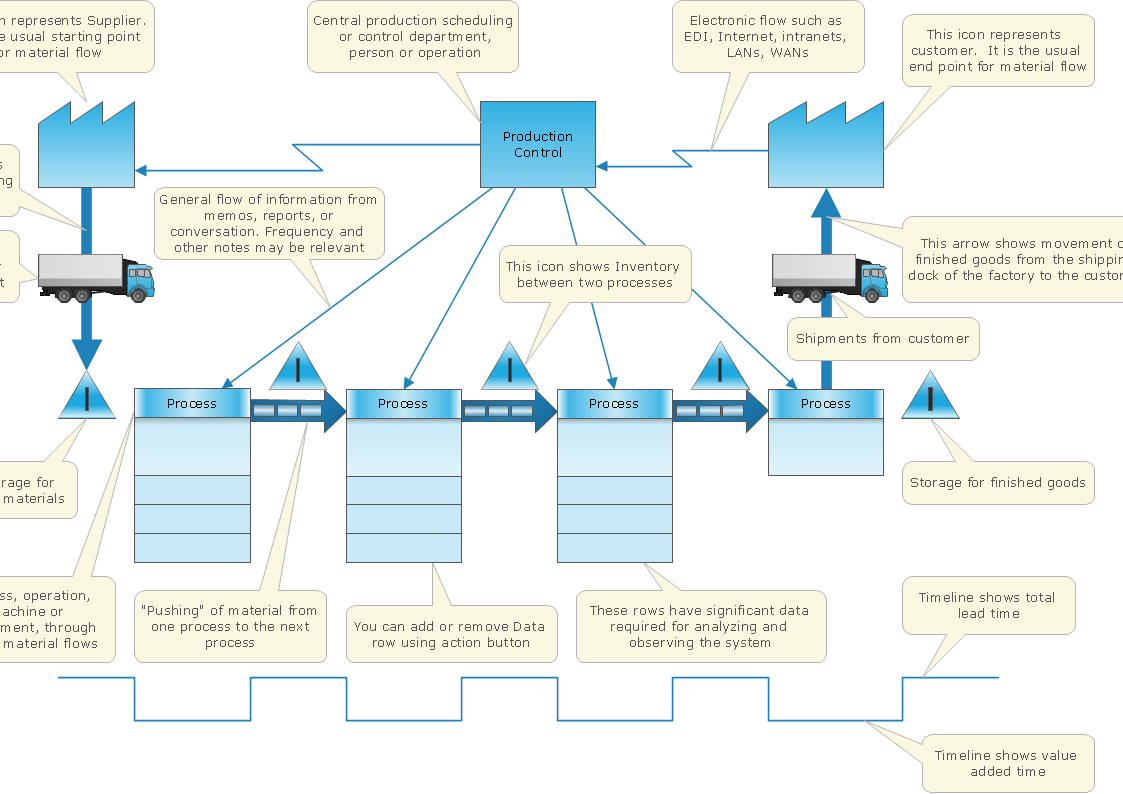
Value stream mapping solution extends ConceptDraw DIAGRAM software with templates, samples and vector stencils for drawing the Value Stream Maps (VSM) in lean manufacturing practice.
 ConceptDraw Solution Park
ConceptDraw Solution Park collects graphic extensions, examples and learning materials
Business Diagram Software


 Flowcharts
The Flowcharts solution for ConceptDraw DIAGRAM is a comprehensive set of examples and samples in several varied color themes for professionals that need to represent graphically a process. Solution value is added by the basic flow chart template and shapes' libraries of flowchart notation. ConceptDraw DIAGRAM flow chart creator lets one depict the processes of any complexity and length, as well as design the Flowchart either vertically or horizontally.
 Education Mind Maps
This solution extends ConceptDraw MINDMAP software with scientific and educational mind maps for educational documents, presentations, and websites.
Contoh Flowchart

 Cross-Functional Flowcharts
Cross-functional flowcharts are powerful and useful tool for visualizing and analyzing complex business processes which requires involvement of multiple people, teams or even departments. They let clearly represent a sequence of the process steps, the order of operations, relationships between processes and responsible functional units (such as departments or positions).
 Audit Flowcharts
Audit flowcharts solution extends ConceptDraw DIAGRAM software with templates, samples and library of vector stencils for drawing the audit and fiscal flow charts.
Venn Diagram Examples for Problem Solving. Environmental Social Science. Human Sustainability Confluence

Venn Diagram Examples for Problem Solving. Computer Science. Chomsky Hierarchy

ConceptDraw Arrows10 Technology

 Chemical and Process Engineering
This chemical engineering solution extends ConceptDraw DIAGRAM.9.5 (or later) with process flow diagram symbols, samples, process diagrams templates and libraries of design elements for creating process and instrumentation diagrams, block flow diagrams (BFD
Venn Diagram Examples for Problem Solving

 Event-driven Process Chain Diagrams
Event-Driven Process Chain Diagrams solution extends ConceptDraw DIAGRAM functionality with event driven process chain templates, samples of EPC engineering and modeling the business processes, and a vector shape library for drawing the EPC diagrams and EPC flowcharts of any complexity. It is one of EPC IT solutions that assist the marketing experts, business specialists, engineers, educators and researchers in resources planning and improving the business processes using the EPC flowchart or EPC diagram. Use the EPC solutions tools to construct the chain of events and functions, to illustrate the structure of a business process control flow, to describe people and tasks for execution the business processes, to identify the inefficient businesses processes and measures required to make them efficient.
ConceptDraw Arrows10 Technology
 Accounting Flowcharts
Accounting Flowcharts solution extends ConceptDraw DIAGRAM software with templates, samples and library of vector stencils for drawing the accounting flow charts.
 Mathematics
Mathematics solution extends ConceptDraw DIAGRAM software with templates, samples and libraries of vector stencils for drawing the mathematical illustrations, diagrams and charts.
 Data Flow Diagrams (DFD)
Data Flow Diagrams solution extends ConceptDraw DIAGRAM software with templates, samples and libraries of vector stencils for drawing the data flow diagrams (DFD).
- Process Flowchart | Flowcharts | Venn Diagram Examples for ...
- LLNL Flow Charts | Material Requisition Flowchart . Flowchart ...
- Process Flowchart | Flowcharts | Venn Diagram Examples for ...
- Flow process chart | Value stream with ConceptDraw PRO ...
- Flow process chart
- Types of Flowchart - Overview | Process Flowchart | Cross ...
- Process Flowchart | Flow chart Example. Warehouse Flowchart ...
- Data Flow Diagrams | Value Stream Mapping | Structured Systems ...
- ConceptDraw Solution Park | Sample Project Flowchart . Flowchart ...
- Process Flowchart | Value stream with ConceptDraw PRO ...
- Design elements - Nuclear physics | Event-driven Process Chain ...
- Audio and Video Connector | Illustration Area | Standard Shapes for ...
- ConceptDraw Arrows10 Technology | eLearning for Skype | Cross ...
- Venn Diagram Examples for Problem Solving. Computer Science ...
- Flow chart Example. Warehouse Flowchart | Types of Flowchart ...
- Flowchart Software | Flow chart Example. Warehouse Flowchart ...
- Solving quadratic equation algorithm - Flowchart | Process ...
- Cross-Functional Process Map Template | Business Process ...
- Types of Flowchart - Overview | Flow chart Example. Warehouse ...
- Cross-Functional Flowchart (Swim Lanes) | ConceptDraw Solution ...