Lean Six Sigma Diagram Software
Lean Six Sigma (LSS) is a well-known in all over the world methodology of quality improvement and business perfection. ConceptDraw DIAGRAM diagramming and vector drawing software is a powerful Lean Six Sigma Diagram Software thanks to the included Value Stream Mapping solution from the Quality Management Area of ConceptDraw Solution Park.7 Management & Planning Tools
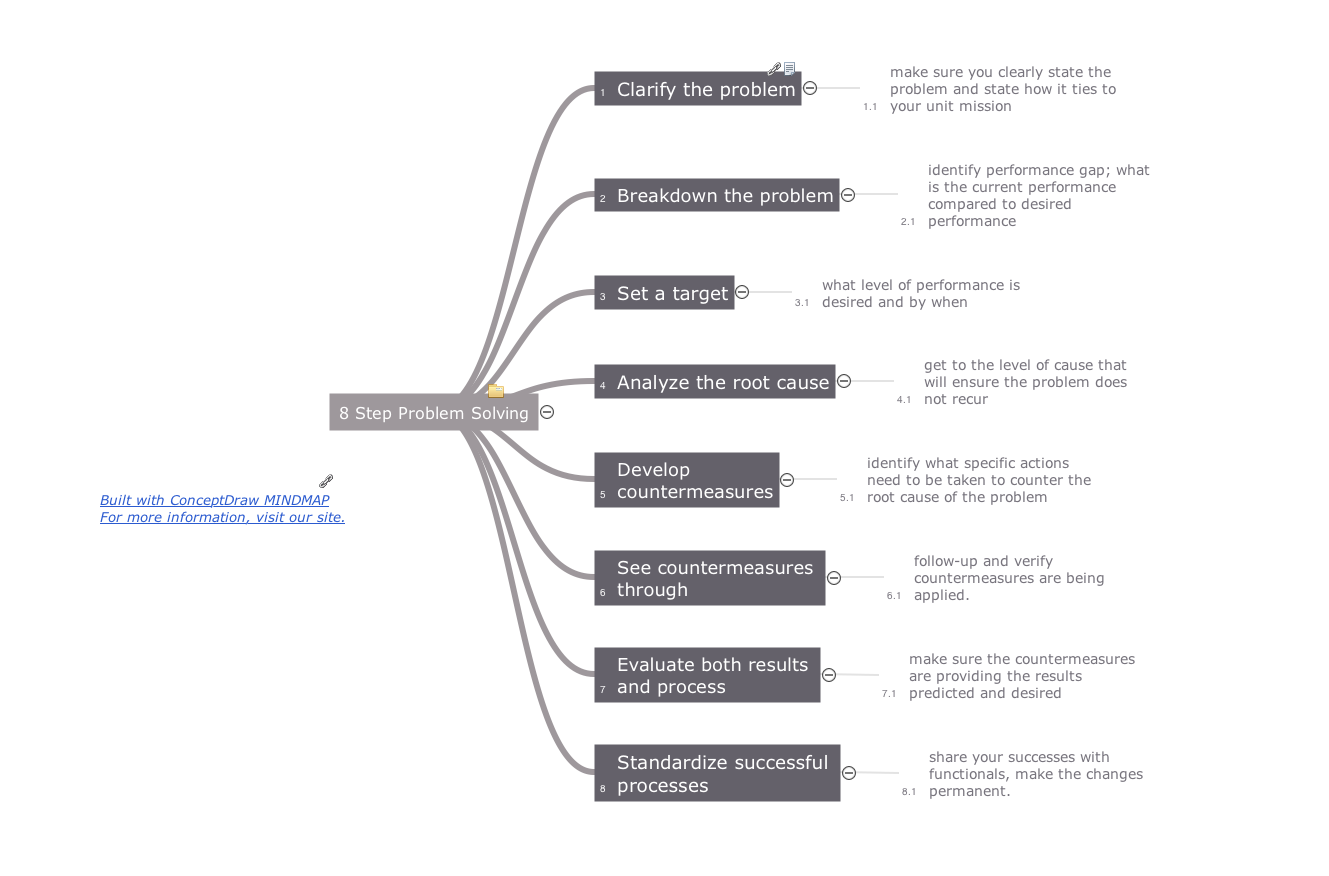
The 7 Management and Planning Tools solution available from ConceptDraw Solution Park implements well-known methodologies and provides the comprehensive set of tools for problems' analysis and solving. Different products from multifunctional ConceptDraw Office suite may be used as a complete solution for any of methodologies offered by this solution and provide a visual communication during every stage of work. Use the MINDMAP 7 Management & Planning Tools for step-by-step identification and analysis the problems, for planning solving and corrective actions, and also countermeasures to address the risks. 7 Management and Planning Tools solution is perfect for managers in medium to large companies, who require effective tools to address the management issue, for business consultants, trainers and coaches to help visualize the problem's solving by using 7 MP Tools methodology, to structure the problem's affecting factors, analyze their root causes and cause and effect relations, to highlight drivers and indicators factors, to prioritize factors using ranking by criteria set.Quality Control
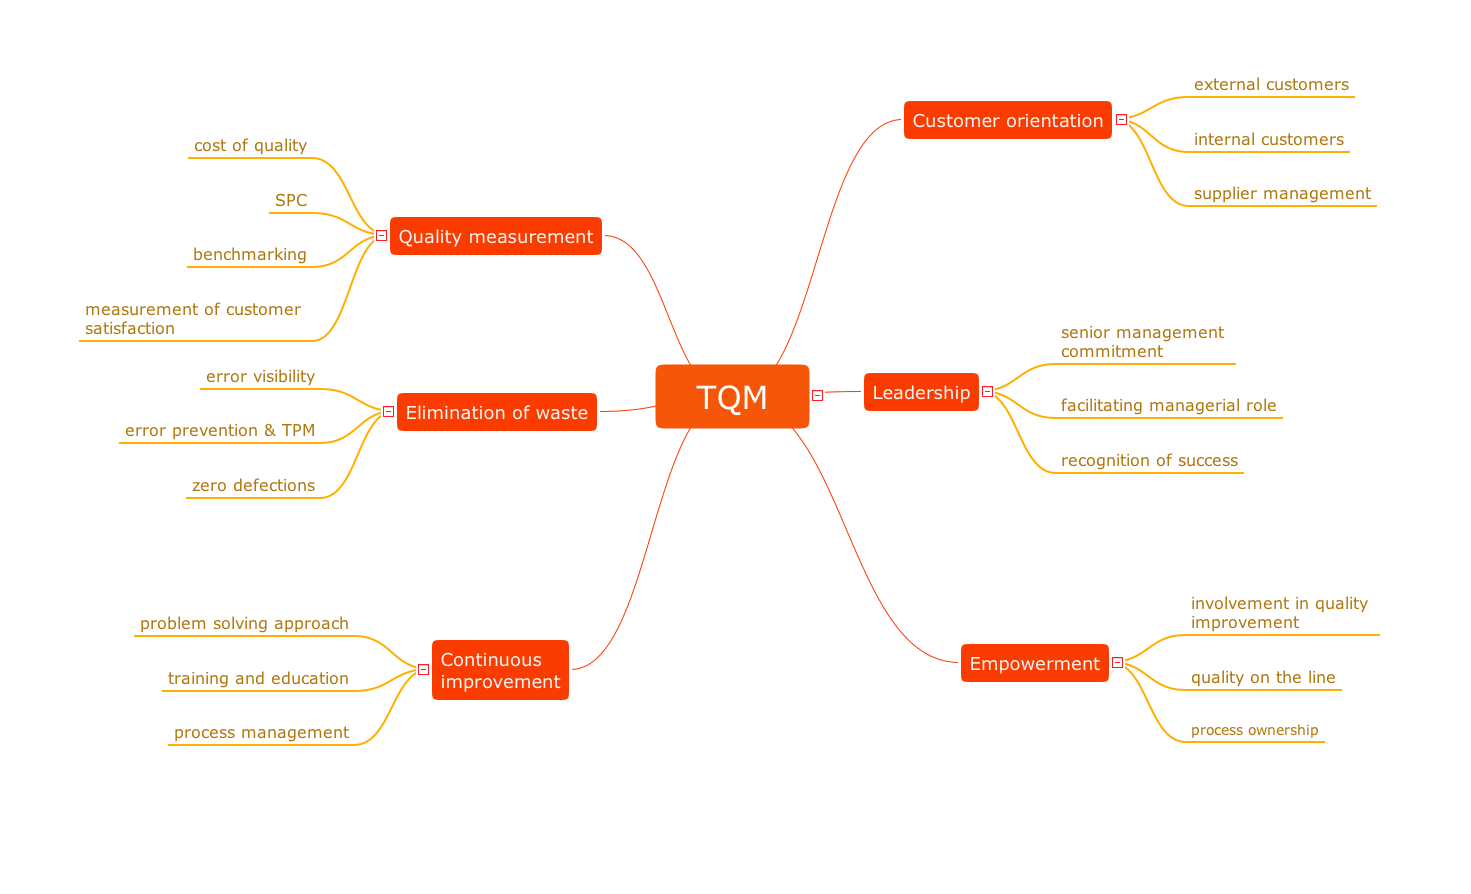
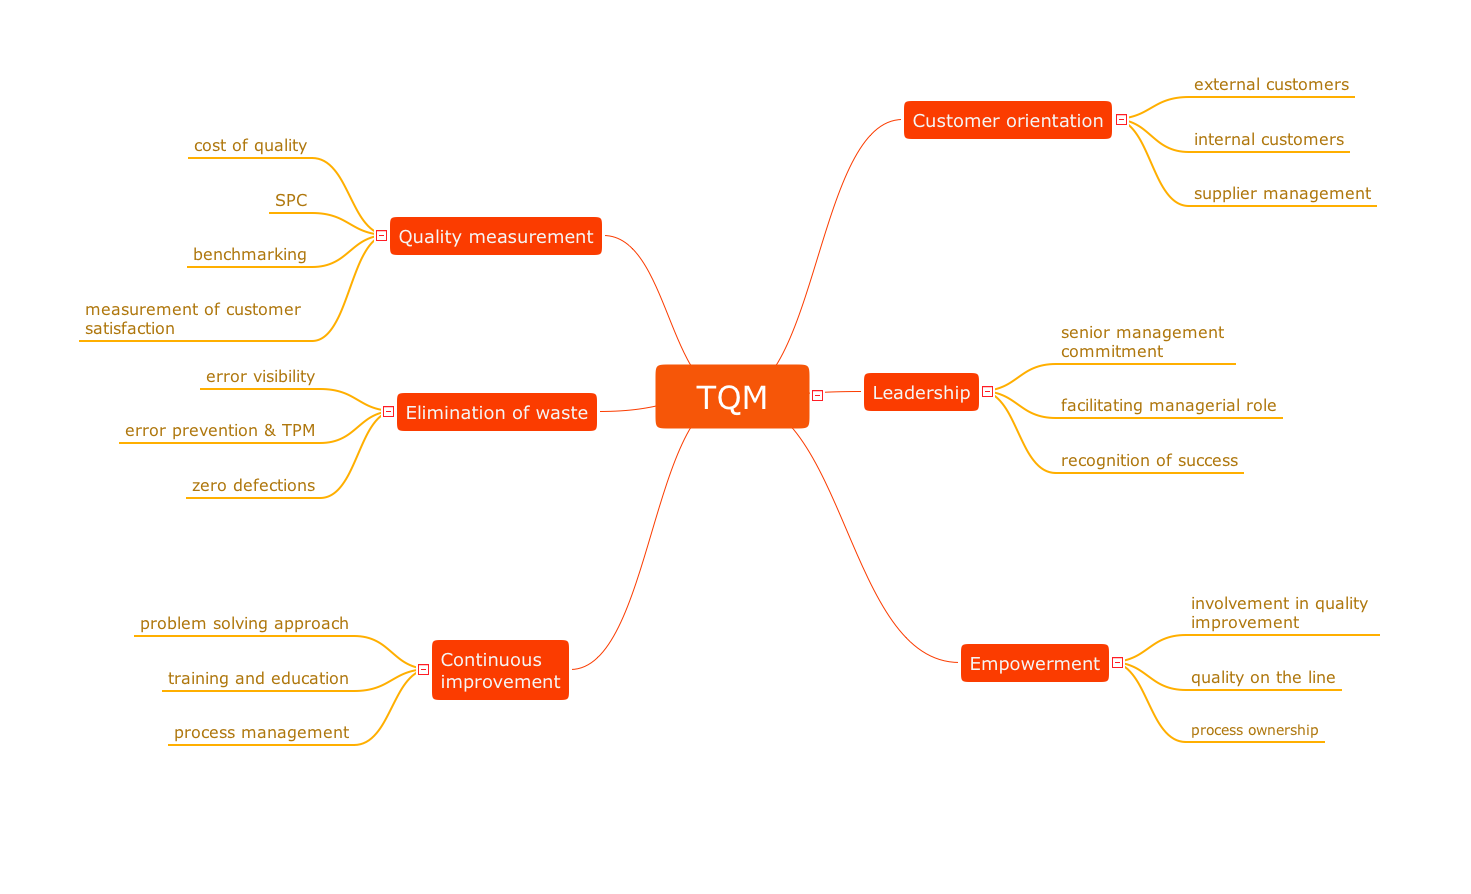
Using mind mapping for quality management is a creative approach that allows one to structure all key quality points on the one page.Total Quality Management
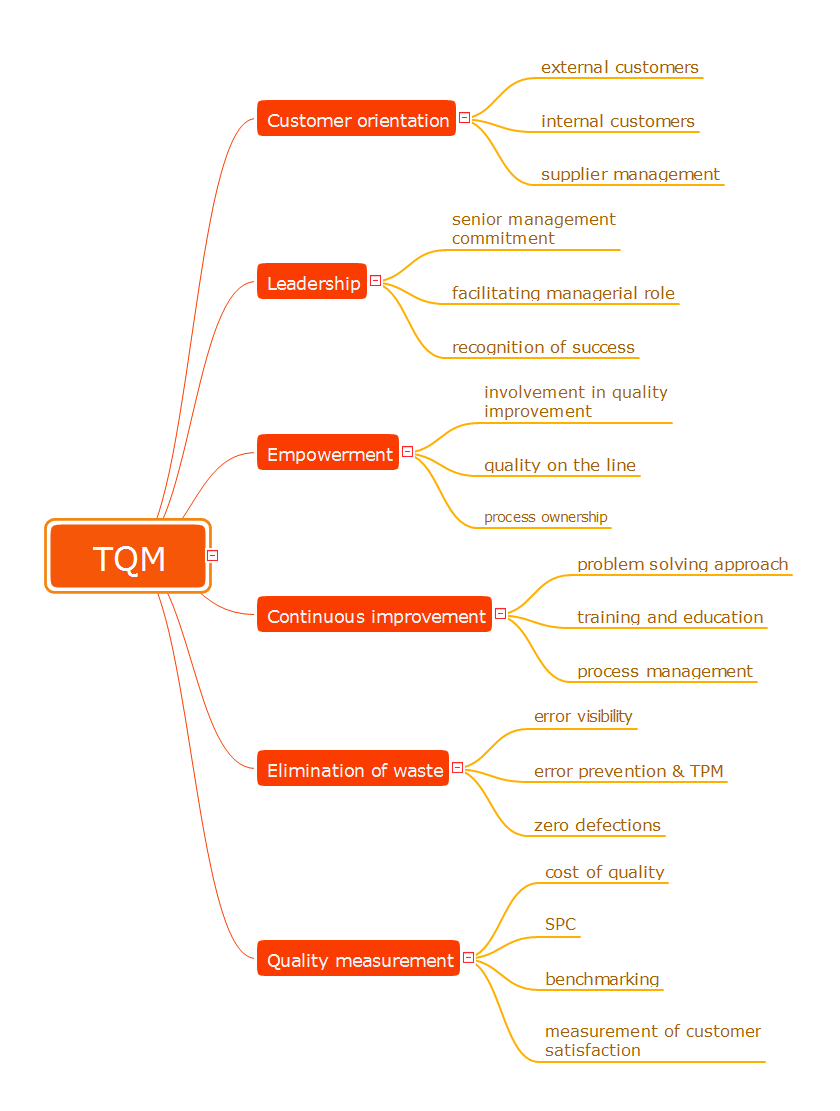
The desire to encourage the production of competitive goods led to the establishment of new method of continuous quality improvement of all organizational processes, production and service. This method successfully launched in Japan and the USA was named Total Quality Management (TQM). Now, the TQM is a dynamically developed concept, a strategic approach to management that is based on manufacturing goods or services of the best quality among innovative counterparts from the point of view of consumers. The main idea of TQM is that the company should work not only on the product quality, but also on the quality of company's work, including the work of staff. The constant parallel improvement of product quality, quality of organization processes, level of qualification the personnel allow to achieve more rapid and effective business development. Mind Maps are effective in a field of quality management and allow to structure all key quality points on one page. This Mind Map designed in ConceptDraw MINDMAP software illustrates the well-known Total Quality Management (TQM) methodology.Value Stream Analysis
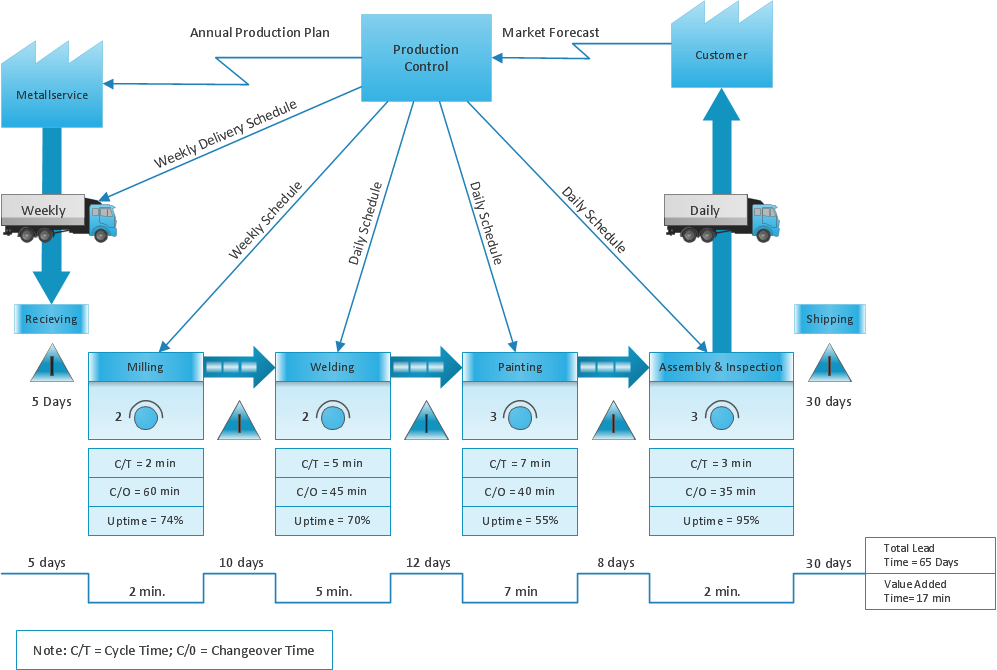
ConceptDraw Value Stream Maps are used in lean practice for analysis of manufacturing processes to identify the improvement opportunities.Booch OOD Diagram
The vector stencils library Booch OOD from the solution Software Engineering contains specific symbols of the Booch method such as class symbols, association symbols, aggregation symbols for ConceptDraw DIAGRAM diagramming and vector drawing software. The Software Engineering solution is contained in the Software Development area of ConceptDraw Solution Park.Quality Improvement
Constant improvement of key performance indicators that are related to quality is a step in the right direction for a company interested in market growth.The Lean Enterprise Value Stream Mapping
Create value stream maps - for value stream analysis and value stream management, material and information flow mapping, using our quick start templates included with ConceptDraw.Total Quality Management
Apart from a well-known quality management, there is also such term as a Total quality management that consists of some particular organization-wide efforts that are taken in order to install and to make permanent some definite climate in which an organization can continuously improve its ability to deliver only high-quality products/services to its customers.Total quality management techniques are known to be drawing on the previously developed ones used within the quality control. Total quality management enjoyed widespread attention during the early 1990s before being overshadowed by Lean manufacturing, ISO 9000 and Six Sigma.
Value Stream Mapping Icons
The library with 40 vector stencils is included in the ConceptDraw Value Stream Mapping solution.
 Quality Mind Map
This solution extends ConceptDraw MINDMAP software with Quality Management Mind Maps (Presentations, Meeting Agendas, Problem to be solved).
 Business Process Diagrams
Business Process Flow Diagrams solution extends the ConceptDraw DIAGRAM BPM software with RapidDraw interface, templates, business process diagrams examples and numerous libraries based on the BPMN 1.2 and BPMN 2.0 standards, which give you the possibility to visualize equally easy simple and complex processes, to design business models, to quickly develop and document in details any business processes on the stages of project’s planning and implementation.
Business Processes description with ConceptDraw DIAGRAM
Business Processes description with ConceptDraw. Business-processes it allows to describe functional blocks, for example production and marketing. ConceptDraw lets creation of business processes description using IDEF0 and IDEF2 methods.Total Quality Management Density
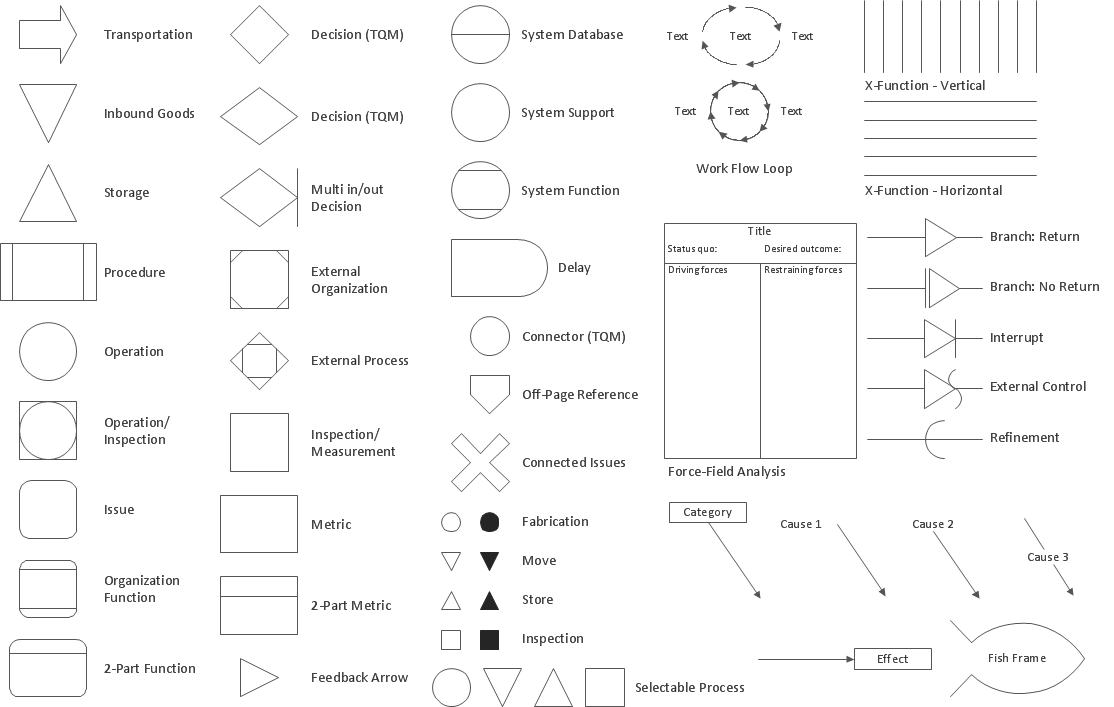
The Total Quality Management Diagram solution helps you and your organization visualize business and industrial processes. Create Total Quality Management diagrams for business process with ConceptDraw software.How To Create Project Report
ConceptDraw PROJECT contains an extensive tool set to help project managers. The rich data visualization capability that is provided by ConceptDraw products helps you create project dashboards, one-click reports, multi-project views, Gantt charts, and resource views. Let′s learn how to get maximum value using ConceptDraw PROJECT!Why do you need the quality management for the organization
You can describe your own quality processes, brainstorm, and structure quality issues; then you can easily and quickly present it to your team. Quality Management Mind Maps - Presentations, Meeting Agendas, Problem will be solved.Helpful in all stages of quality management
ConceptDraw Mind maps can be used to depict a quality process.
 Data Flow Diagrams (DFD)
Data Flow Diagrams solution extends ConceptDraw DIAGRAM software with templates, samples and libraries of vector stencils for drawing the data flow diagrams (DFD).
JSD - Jackson system development
Jackson System Development (JSD) is a linear method of system development created by Michael A. Jackson and John Cameron in the 1980s. It comprises the whole software life cycle directly or providing a framework for more specialized techniques. When implementing the Jackson System Development method and designing JSD diagrams, you can succesfully use the powerful and helpful tools of ConceptDraw DIAGRAM software extended with Entity-Relationship Diagram (ERD) solution from the Software Development area of ConceptDraw Solution Park.- Process Flowchart | TQM Diagram Example | Definition TQM ...
- Flow Chart Quality Pictures
- House of Quality Matrix Software | Total Quality Management ...
- Qualty Company Images Digaram
- Hd Images Er Diagram For Manufacturing Process
- Structured Systems Analysis and Design Method . SSADM with ...
- Network Layout Methodology
- Quality Control Diagram Industry Hd Photos
- Gantt Chart For Methodology Project Software Engineering
- TQM Diagram Tool | Picture Graphs | Seven Basic Tools of Quality ...
- Definition TQM Diagram | Organizational Structure Total Quality ...
- Total Quality Management Definition | Process Flowchart | Block ...
- Total Quality Management | Seven Basic Tools of Quality - Flow ...
- Data Flow Diagram | Example of DFD for Online Store (Data Flow ...
- Lean Six Sigma Diagram Software | Lean Manufacturing Diagrams ...
- Basic Flowchart Symbols and Meaning | Flow Chart Symbols | Basic ...
- Fishbone Diagrams | Fishbone diagram - HAN project | DroidDia ...
- TQM Software — Build Professional TQM Diagrams | Total Quality ...
- Helpful in all stages of quality management | Pyramid Diagram ...
- Entity-Relationship Diagram (ERD) | Data Flow Diagrams (DFD ...


