Business Processes

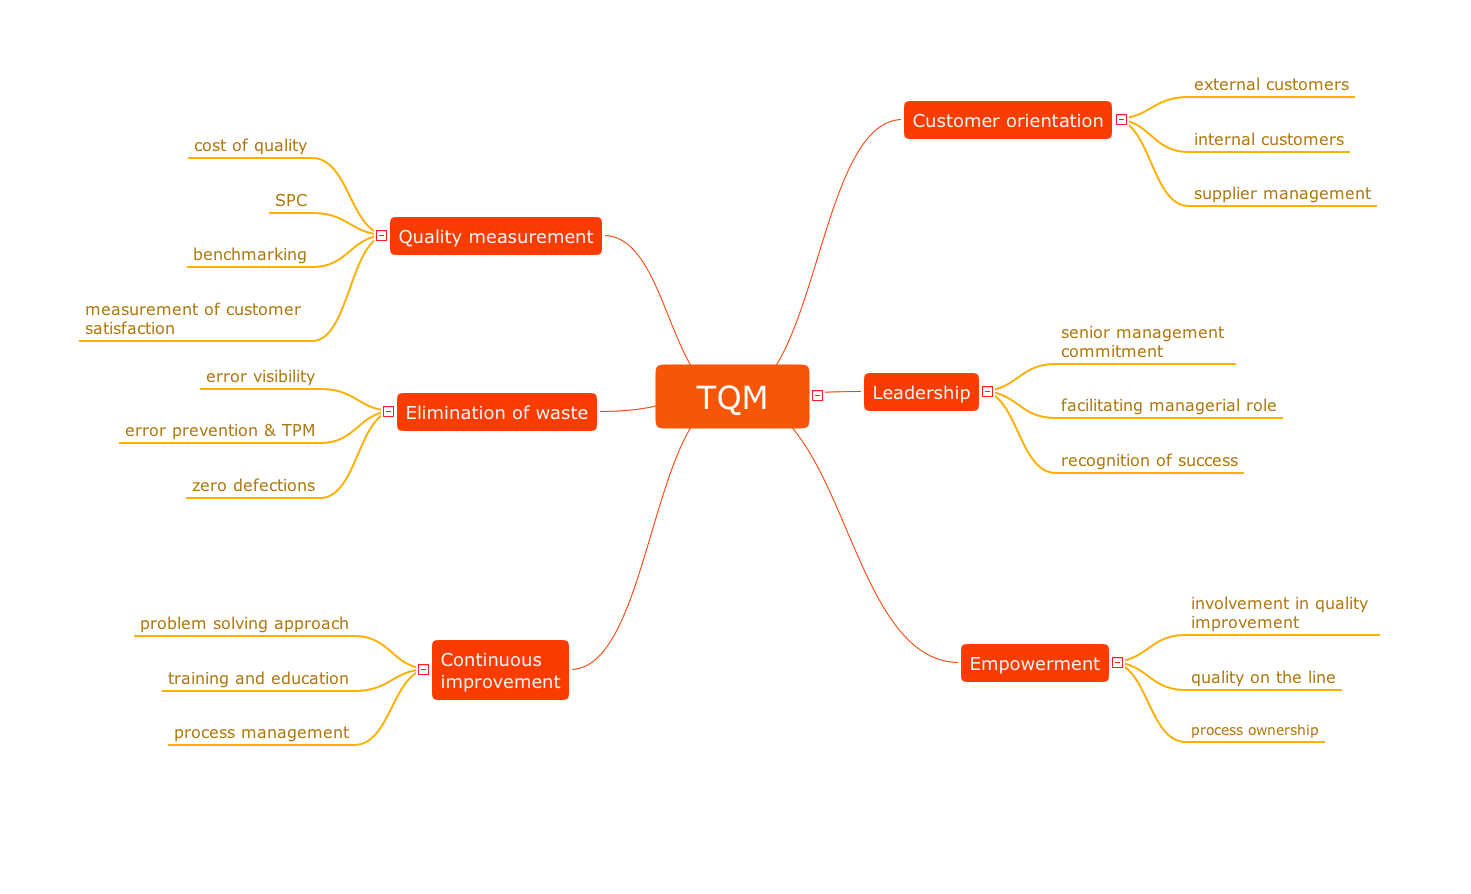
Organizational Structure Total Quality Management

Swim Lane Diagrams

Workflow Diagram

 Entity-Relationship Diagram (ERD)
An Entity-Relationship Diagram (ERD) is a visual presentation of entities and relationships. That type of diagrams is often used in the semi-structured or unstructured data in databases and information systems. At first glance ERD is similar to a flowch
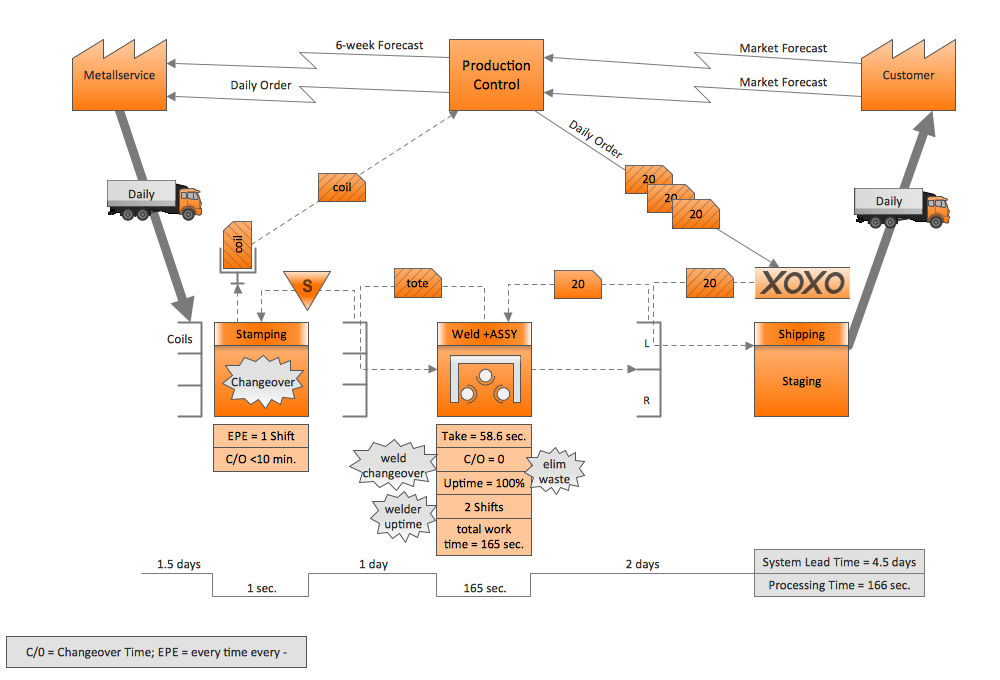
Value Stream & Process Flow Diagramming Software

 Bubble Diagrams
Bubble diagrams have enjoyed great success in software engineering, architecture, economics, medicine, landscape design, scientific and educational process, for ideas organization during brainstorming, for making business illustrations, presentations, planning, design, and strategy development. They are popular because of their simplicity and their powerful visual communication attributes.
 Business Process Diagrams
Business Process Diagrams solution extends the ConceptDraw DIAGRAM BPM software with RapidDraw interface, templates, samples and numerous libraries based on the BPMN 1.2 and BPMN 2.0 standards, which give you the possibility to visualize equally easy simple and complex processes, to design business models, to quickly develop and document in details any business processes on the stages of project’s planning and implementation.
 Event-driven Process Chain Diagrams
Event-Driven Process Chain Diagrams solution extends ConceptDraw DIAGRAM functionality with event driven process chain templates, samples of EPC engineering and modeling the business processes, and a vector shape library for drawing the EPC diagrams and EPC flowcharts of any complexity. It is one of EPC IT solutions that assist the marketing experts, business specialists, engineers, educators and researchers in resources planning and improving the business processes using the EPC flowchart or EPC diagram. Use the EPC solutions tools to construct the chain of events and functions, to illustrate the structure of a business process control flow, to describe people and tasks for execution the business processes, to identify the inefficient businesses processes and measures required to make them efficient.
Quality visualization in your company
 ConceptDraw Solution Park
ConceptDraw Solution Park collects graphic extensions, examples and learning materials
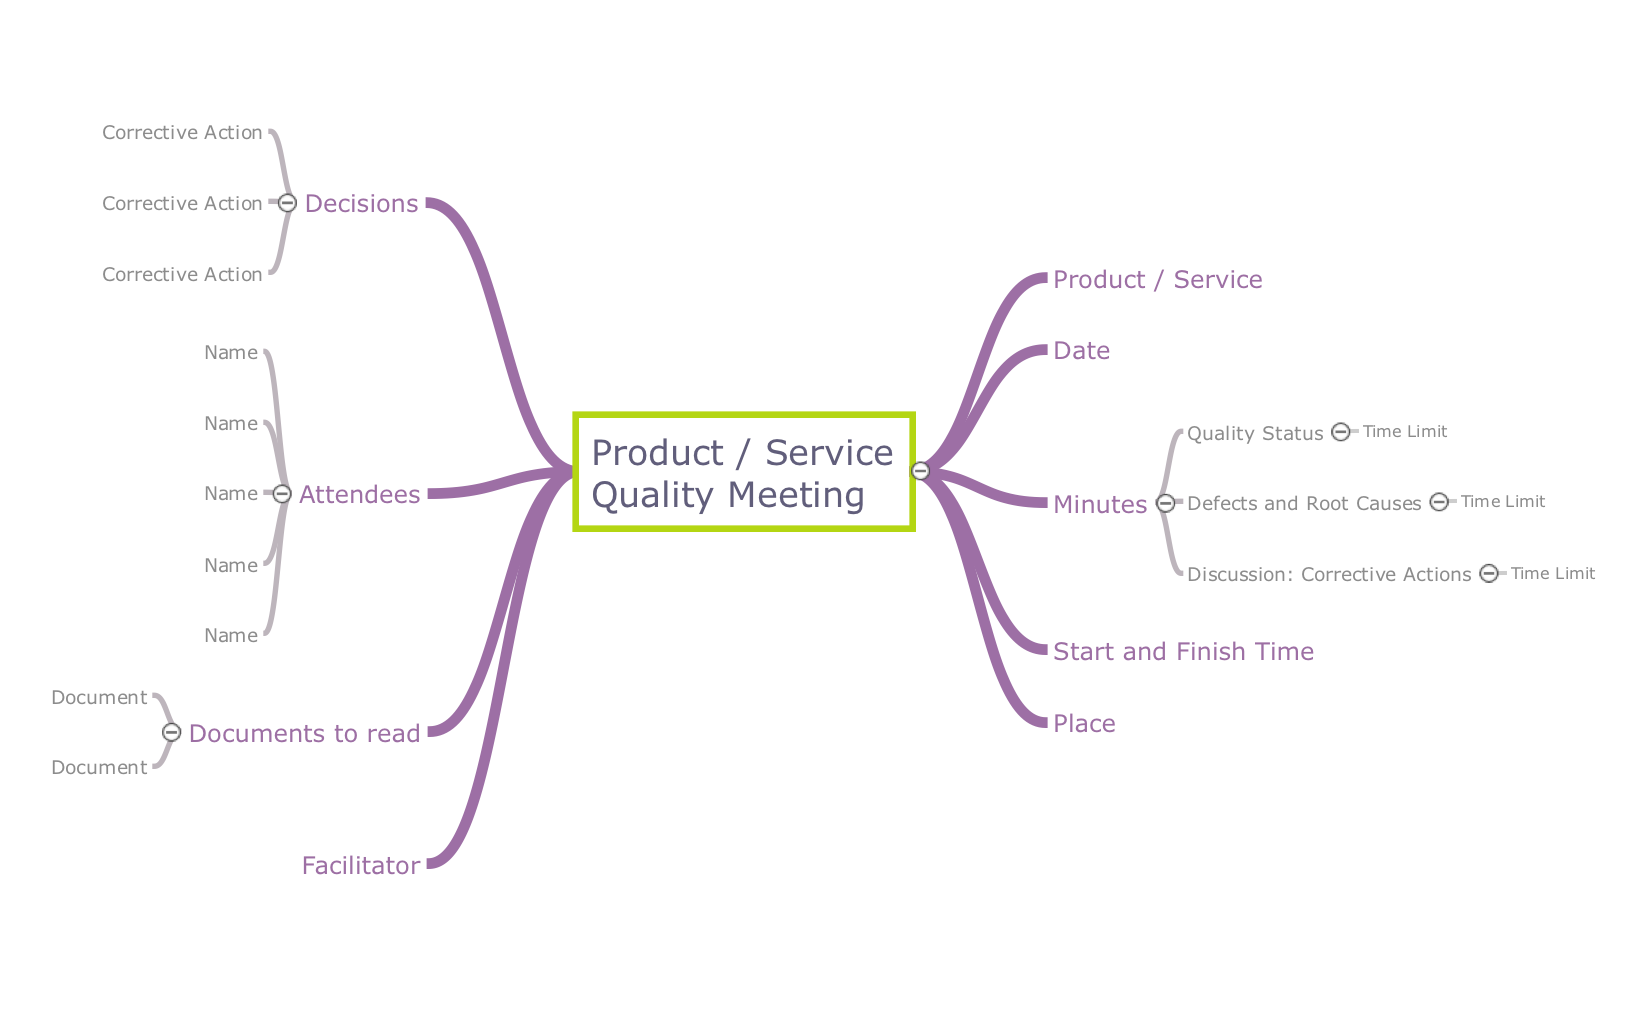
 Quality Mind Map
This solution extends ConceptDraw MINDMAP software with Quality Management Mind Maps (Presentations, Meeting Agendas, Problem to be solved).
 25 Typical Orgcharts
The 25 Typical Orgcharts solution contains powerful organizational structure and organizational management drawing tools, a variety of professionally designed organization chart and matrix organization structure samples, 25 templates based on various orga
 Data Flow Diagrams (DFD)
Data Flow Diagrams solution extends ConceptDraw DIAGRAM software with templates, samples and libraries of vector stencils for drawing the data flow diagrams (DFD).
Successful Quality Management
 iPhone User Interface
iPhone User Interface solution extends ConceptDraw DIAGRAM software with templates, samples and libraries with large quantity of vector stencils of graphical user interface elements, Apps icons, UI patterns for designing and prototyping of the iOS applic
 Network Layout Floor Plans
Network Layout Floor Plans solution extends ConceptDraw DIAGRAM software functionality with powerful tools for quick and efficient documentation the network equipment and displaying its location on the professionally designed Network Layout Floor Plans. Never before creation of Network Layout Floor Plans, Network Communication Plans, Network Topologies Plans and Network Topology Maps was not so easy, convenient and fast as with predesigned templates, samples, examples and comprehensive set of vector design elements included to the Network Layout Floor Plans solution. All listed types of plans will be a good support for the future correct cabling and installation of network equipment.
Quality Engineering Diagrams
- Organizational Structure Total Quality Management
- Quality | Total Quality Management TQM Diagrams | Quality Mind ...
- Fishbone diagram - Production process | Total Quality Management ...
- Affinity diagram - Implementing continuous process improvement ...
- Organizational Structure Total Quality Management | Identifying ...
- Swot Analysis Strengths, Weaknesses, Opportunities, and Threats ...
- Decision Making | Block diagram - Customer decision making | Work ...
- How to Draw an Organization Chart | Organizational Structure Total ...
- Successful Strategic Plan | Management Tools — Total Quality ...
- Organizational Structure | Organizational Structure Total Quality ...
- TQM Diagram — Professional Total Quality Management | Business ...
- Total Quality Management Business Diagram
- TQM Diagram Example
- Organizational Structure | Organizational Structure Total Quality ...
- Total Quality Management TQM Diagrams
- Block diagram - Sources of customer satisfaction | Marketing ...
- PROBLEM ANALYSIS Root Cause Analysis Tree Diagram | Total ...
- Block diagram - Gap model of service quality | Quality Mind Map ...
- Quality Management Teams | Total Quality Management Value ...
- TQM Diagram Example | Seven Management and Planning Tools ...