Constant improvement of key performance indicators
There are available tool to lend a fresh look to quality procedures - ConceptDraw MINDMAP.Organizational Structure Total Quality Management
The Total Quality Management Diagram solution helps you and your organization visualize business and industrial processes. Create Total Quality Management diagrams for business process with ConceptDraw software.Quality Improvement
Constant improvement of key performance indicators that are related to quality is a step in the right direction for a company interested in market growth.Total Quality Management Value
The Total quality management (TQM) is an enterprise-wide method of continuous quality improvement of all organizational processes, including the enhancement of ability to deliver high-quality products and services to the customers. The TQM includes eight main elements, which have great value: customer-focused, process-centered, total employee involvement, integrated system, continual improvement, strategic and systematic approach, fact-based decision making, communications. ConceptDraw DIAGRAM diagramming and vector drawing software offers the Total Quality Management Diagram solution with effective drawing tools, predesigned vector elements, samples and templates that help easy design the Total Quality Management diagrams, TQM flowcharts and Mind Maps widely used in quality management projects to visualize the business processes and industrial processes for your organization, to demonstrate the quality control step-by-step in a visual manner, to compare visually the ideal and real stages of processes.EPC for Business Process Improvement
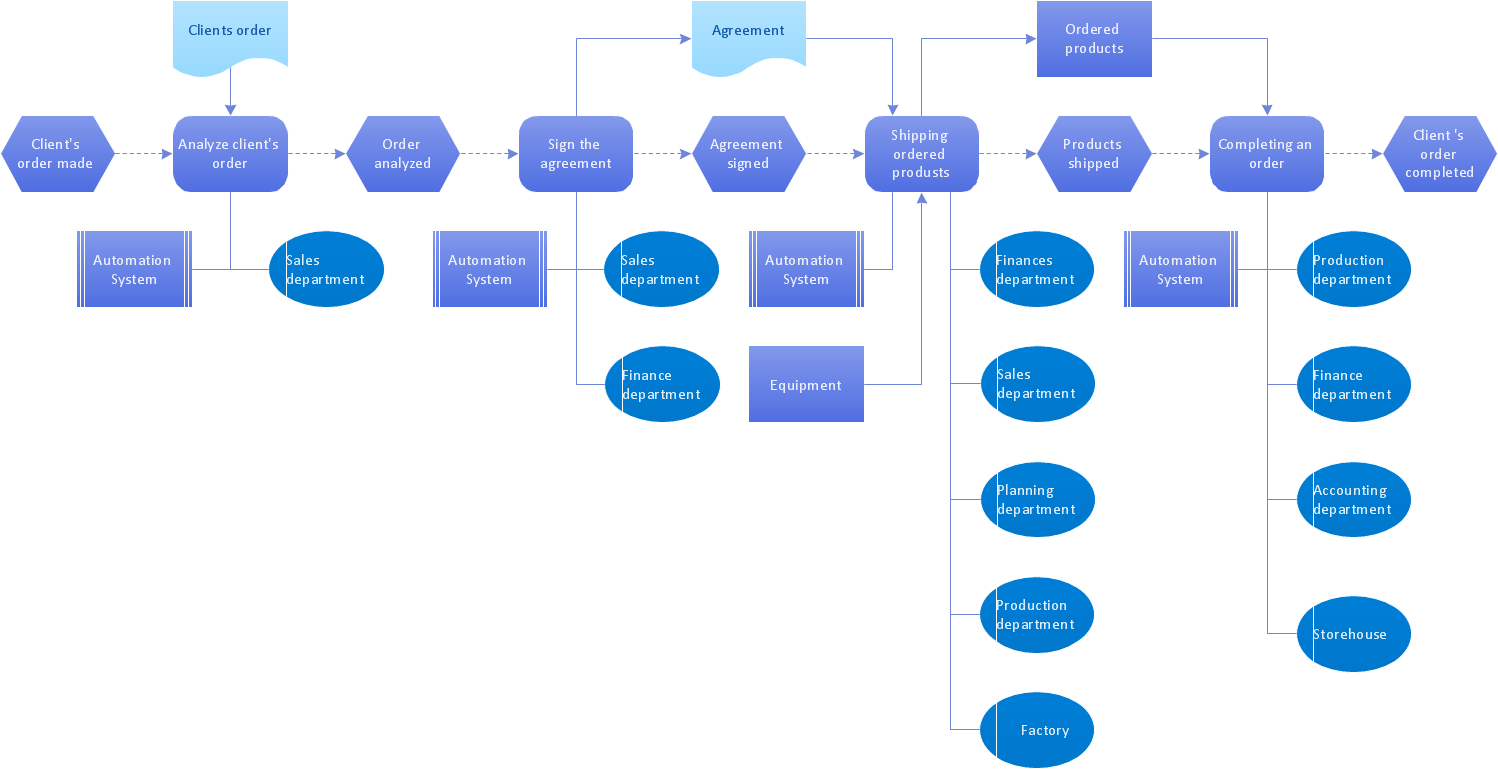
ConceptDraw DIAGRAM - software that reduces the time needed to create a business process model. ConceptDraw DIAGRAM for making EPC diagrams provides business improvement. The Event-driven Process Chain ( EPC ) Diagrams allows reach improvement throughout an organisation."A continual improvement process, also often called a continuous improvement process (abbreviated as CIP or CI), is an ongoing effort to improve products, services, or processes. These efforts can seek "incremental" improvement over time or "breakthrough" improvement all at once. Delivery (customer valued) processes are constantly evaluated and improved in the light of their efficiency, effectiveness and flexibility.
Some see CIPs as a meta-process for most management systems (such as business process management, quality management, project management, and program management)." [Continual improvement process. Wikipedia]
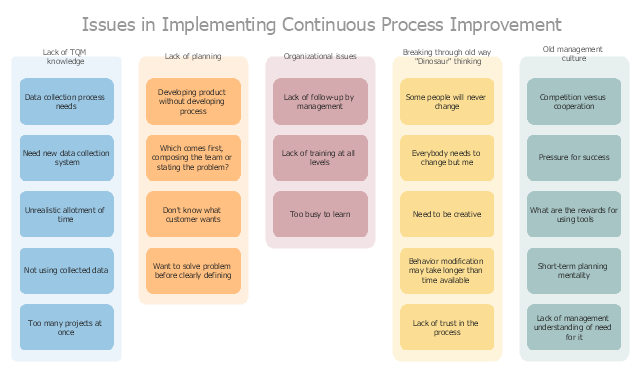
The affinity diagram example "Implementing continuous process improvement" was created using the ConceptDraw PRO diagramming and vector drawing software extended with the solution "Seven Management and Planning Tools" from the Management area of ConceptDraw Solution Park.
A Study of the Business Value of Total Quality Management
The Total Quality Management Diagram solution helps your organization visualize business and industrial processes. Create Total Quality Management diagrams for business process with ConceptDraw software.Mind Mapping in the Quality Management
ConceptDraw MINDMAP has a addition to the ConceptDraw Solution Park that provides a creative approach to visualizing quality processes, Quality Mind Map Solution.Total Quality Management
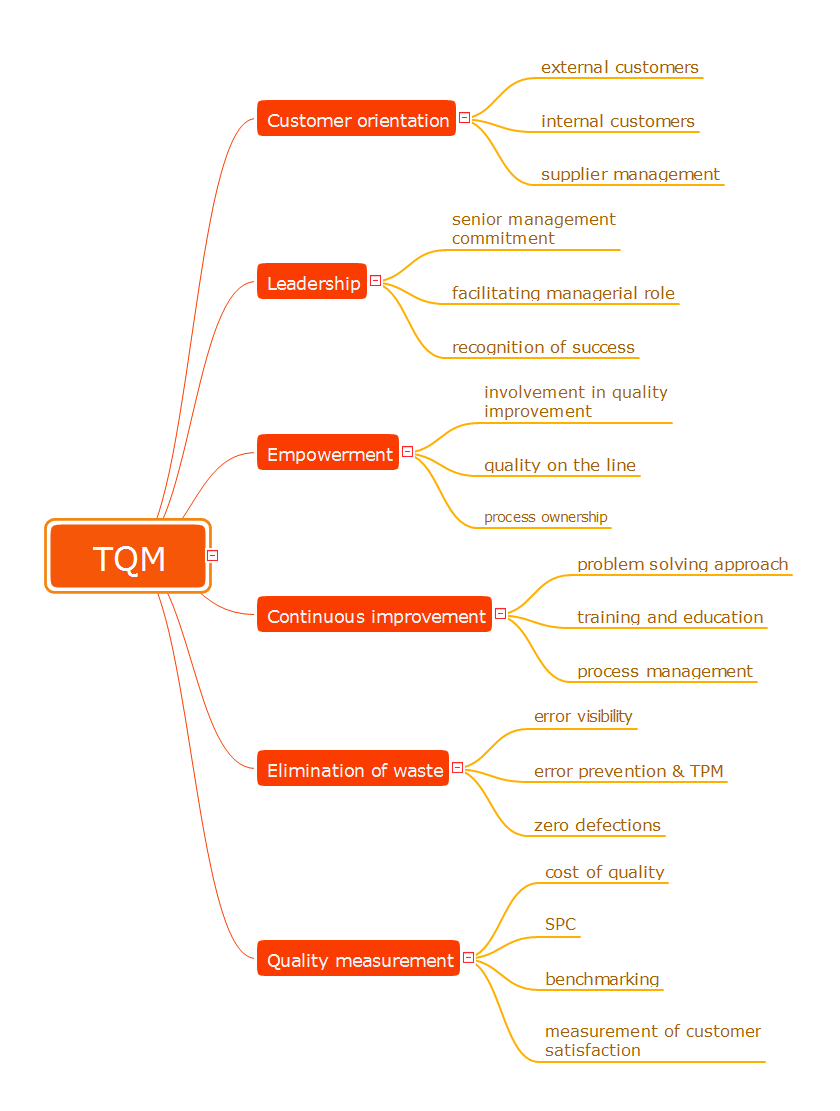
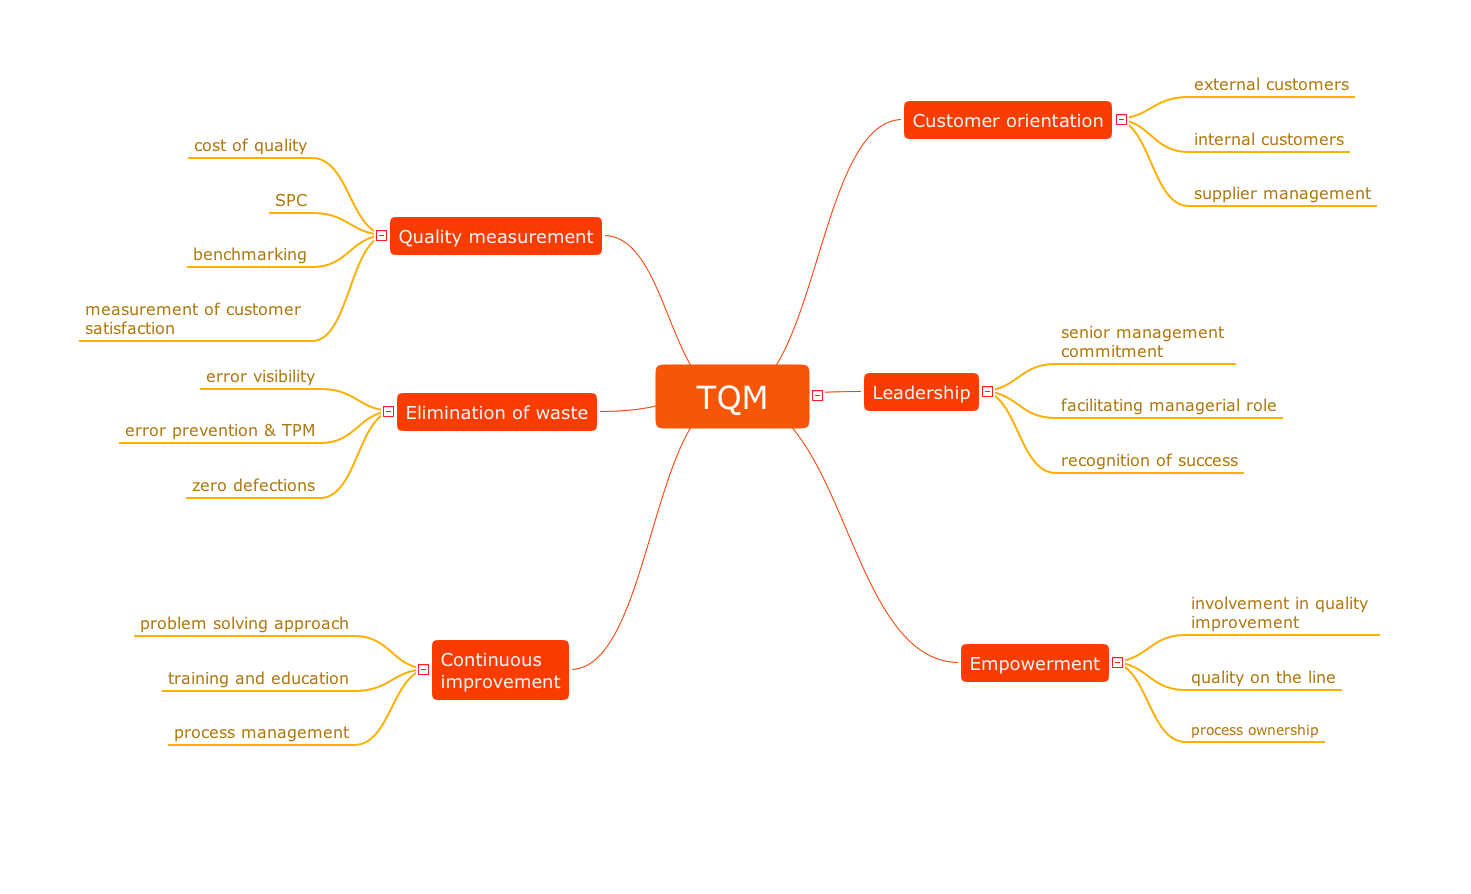
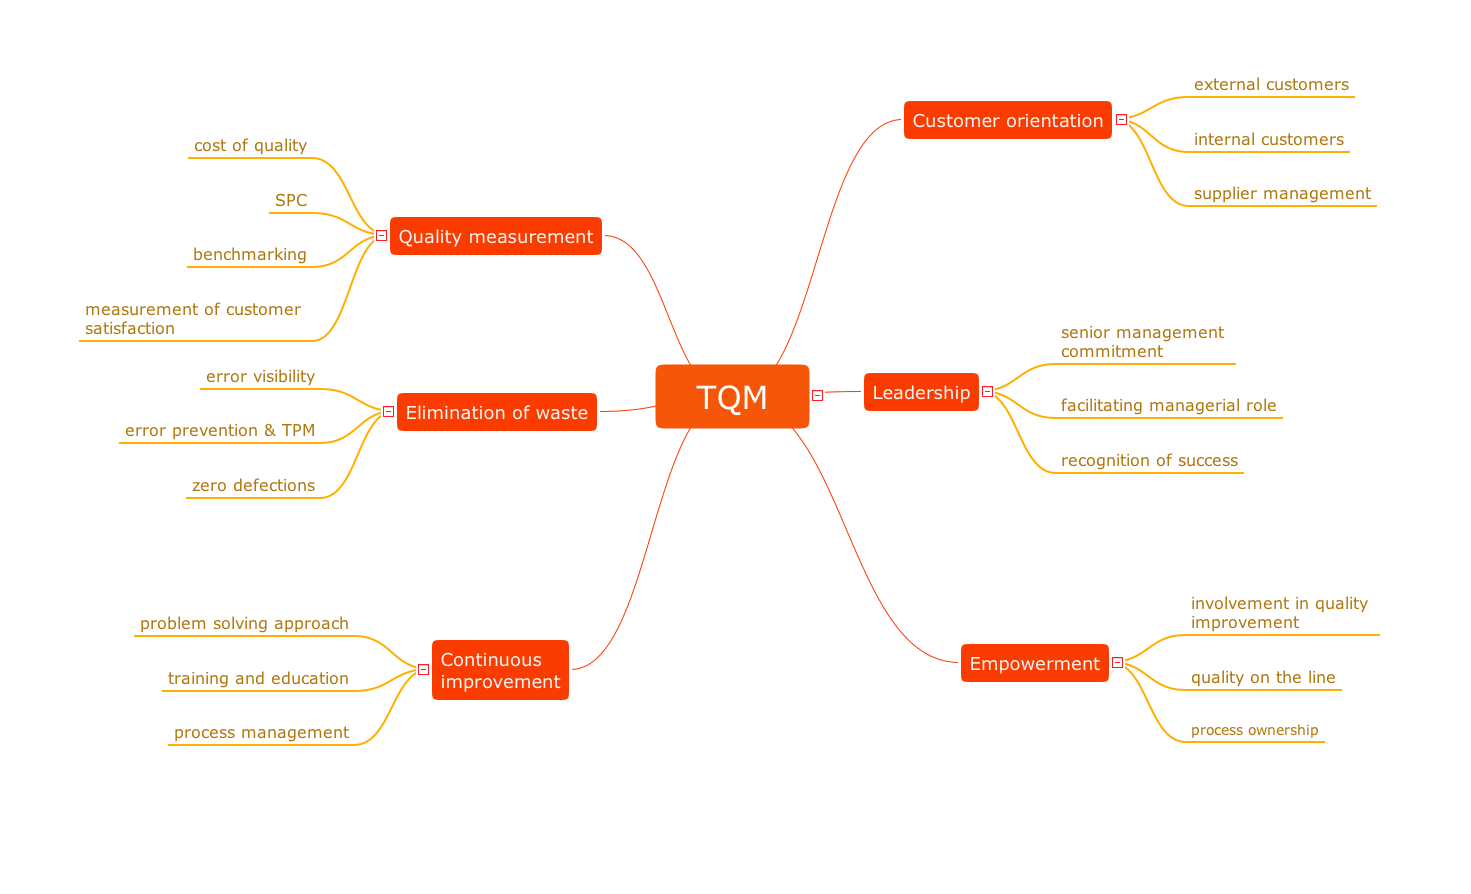
The desire to encourage the production of competitive goods led to the establishment of new method of continuous quality improvement of all organizational processes, production and service. This method successfully launched in Japan and the USA was named Total Quality Management (TQM). Now, the TQM is a dynamically developed concept, a strategic approach to management that is based on manufacturing goods or services of the best quality among innovative counterparts from the point of view of consumers. The main idea of TQM is that the company should work not only on the product quality, but also on the quality of company's work, including the work of staff. The constant parallel improvement of product quality, quality of organization processes, level of qualification the personnel allow to achieve more rapid and effective business development. Mind Maps are effective in a field of quality management and allow to structure all key quality points on one page. This Mind Map designed in ConceptDraw MINDMAP software illustrates the well-known Total Quality Management (TQM) methodology.Total Quality Management Definition
The Total Quality Management Diagram solution helps you and your organization visualize business and industrial processes. Create Total Quality Management diagrams for business process with ConceptDraw software.TQM Diagram Example
The Total Quality Management Diagram solution helps you and your organization visualize business and industrial processes. Create Total Quality Management diagrams for business process with ConceptDraw software.TQM Software — Build Professional TQM Diagrams
The Total Quality Management Diagram solution helps you and your organization visualize business and industrial processes. Create Total Quality Management diagrams for business process with ConceptDraw software.Quality Management System
ConceptDraw DIAGRAM diagramming and vector drawing software extended with Total Quality Management (TQM) Diagrams solution from the Quality area of ConceptDraw Solution Park perfectly suits for development and visually representing a Quality Management System.Lean Management
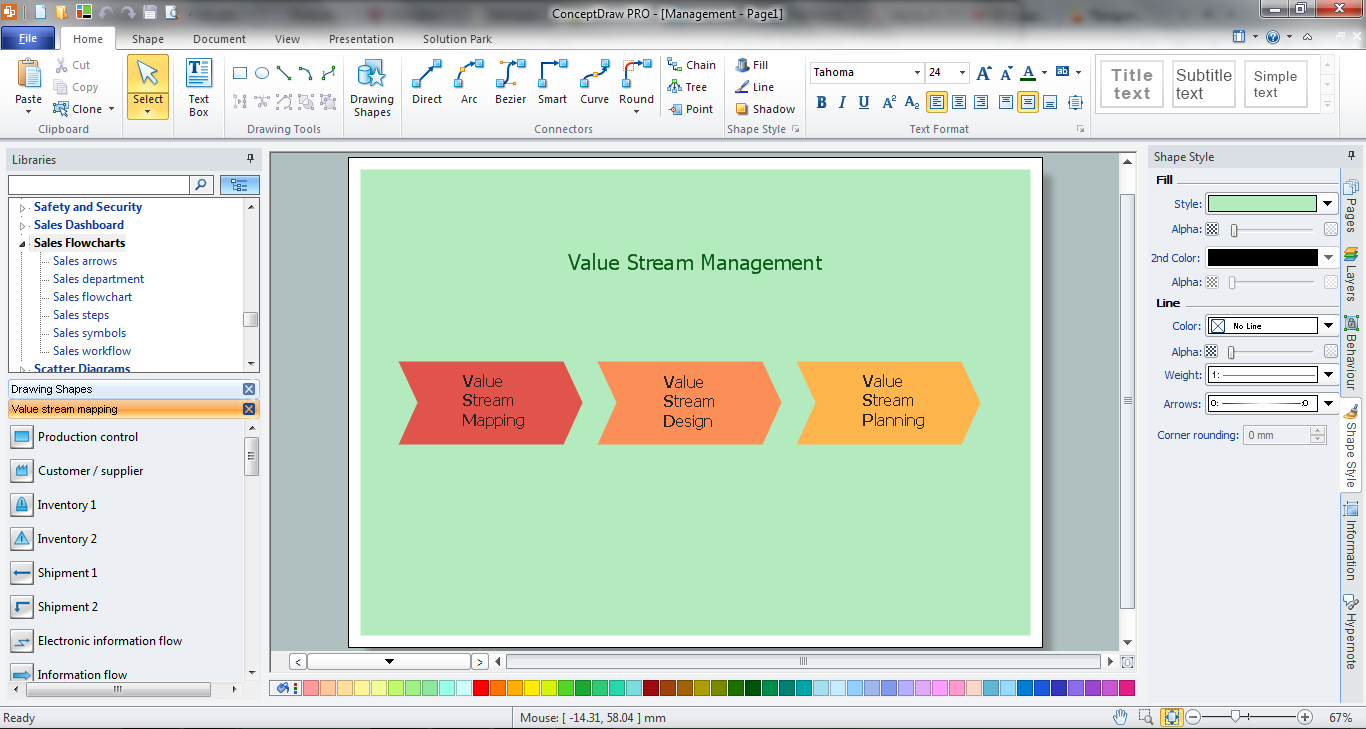
Lean management is an approach to running an organization which seeks to decrease the waste of time, effort or money by identifying each step of a business process. Lean management actively supports the concept of continuous improvement, a long-term approach to work and aspires to the improvement of efficiency and quality. ConceptDraw DIAGRAM extended with Value Stream Mapping solution from the Quality area of ConceptDraw Solution Park is effective software in the field of the lean management.Successful Quality Management
Successful quality management implemented in a company of any size is a critical component of a company’s organization. You can use mind maps for a complete quality process analysis, giving more visibility to the focal points that you need to get clear.Identifying Quality Management System
The Total Quality Management Diagram solution helps your organization visualize business and industrial processes. Create Total Quality Management diagrams for business process with ConceptDraw software.6 sigma
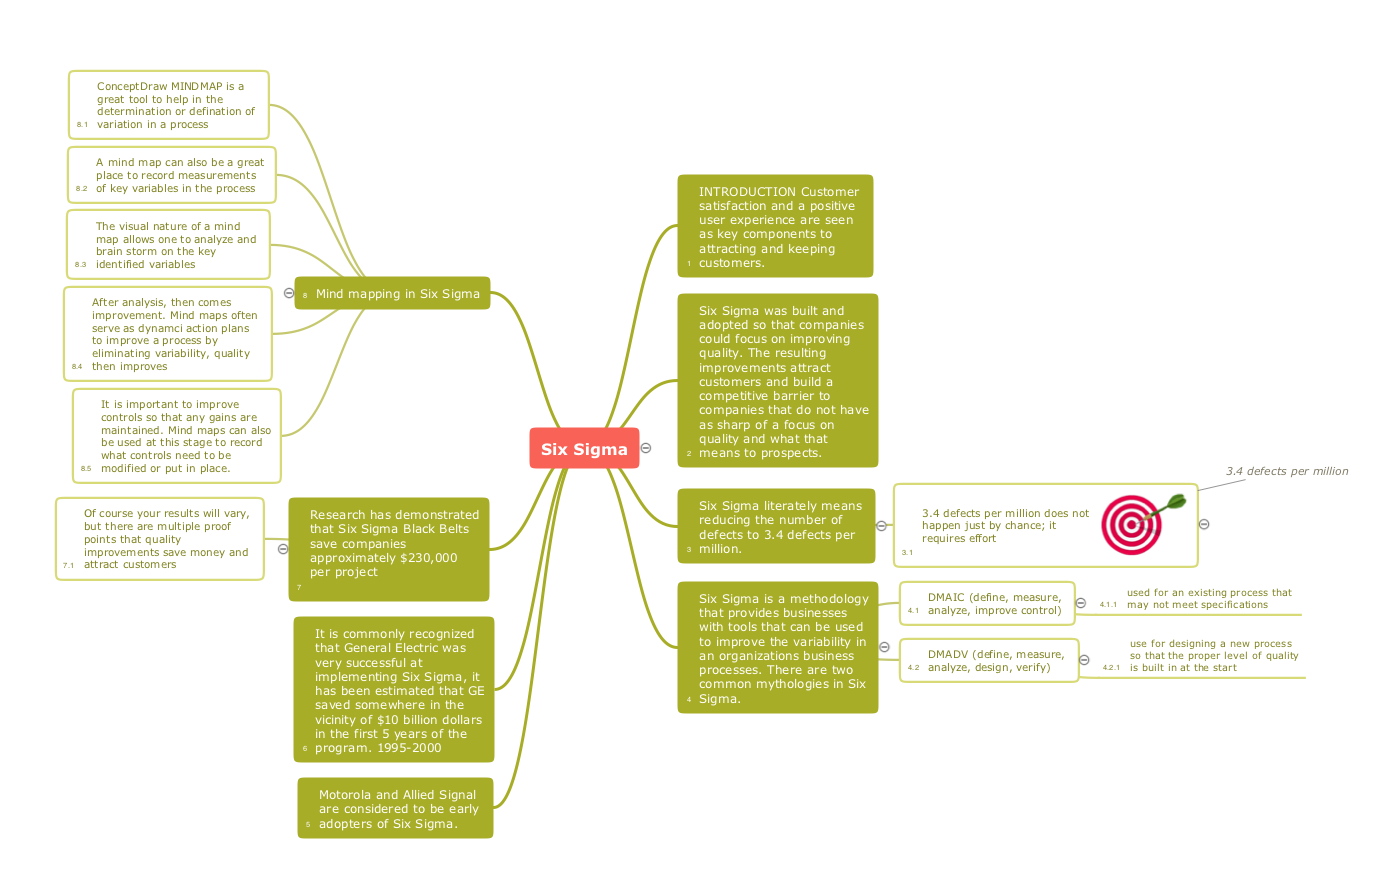
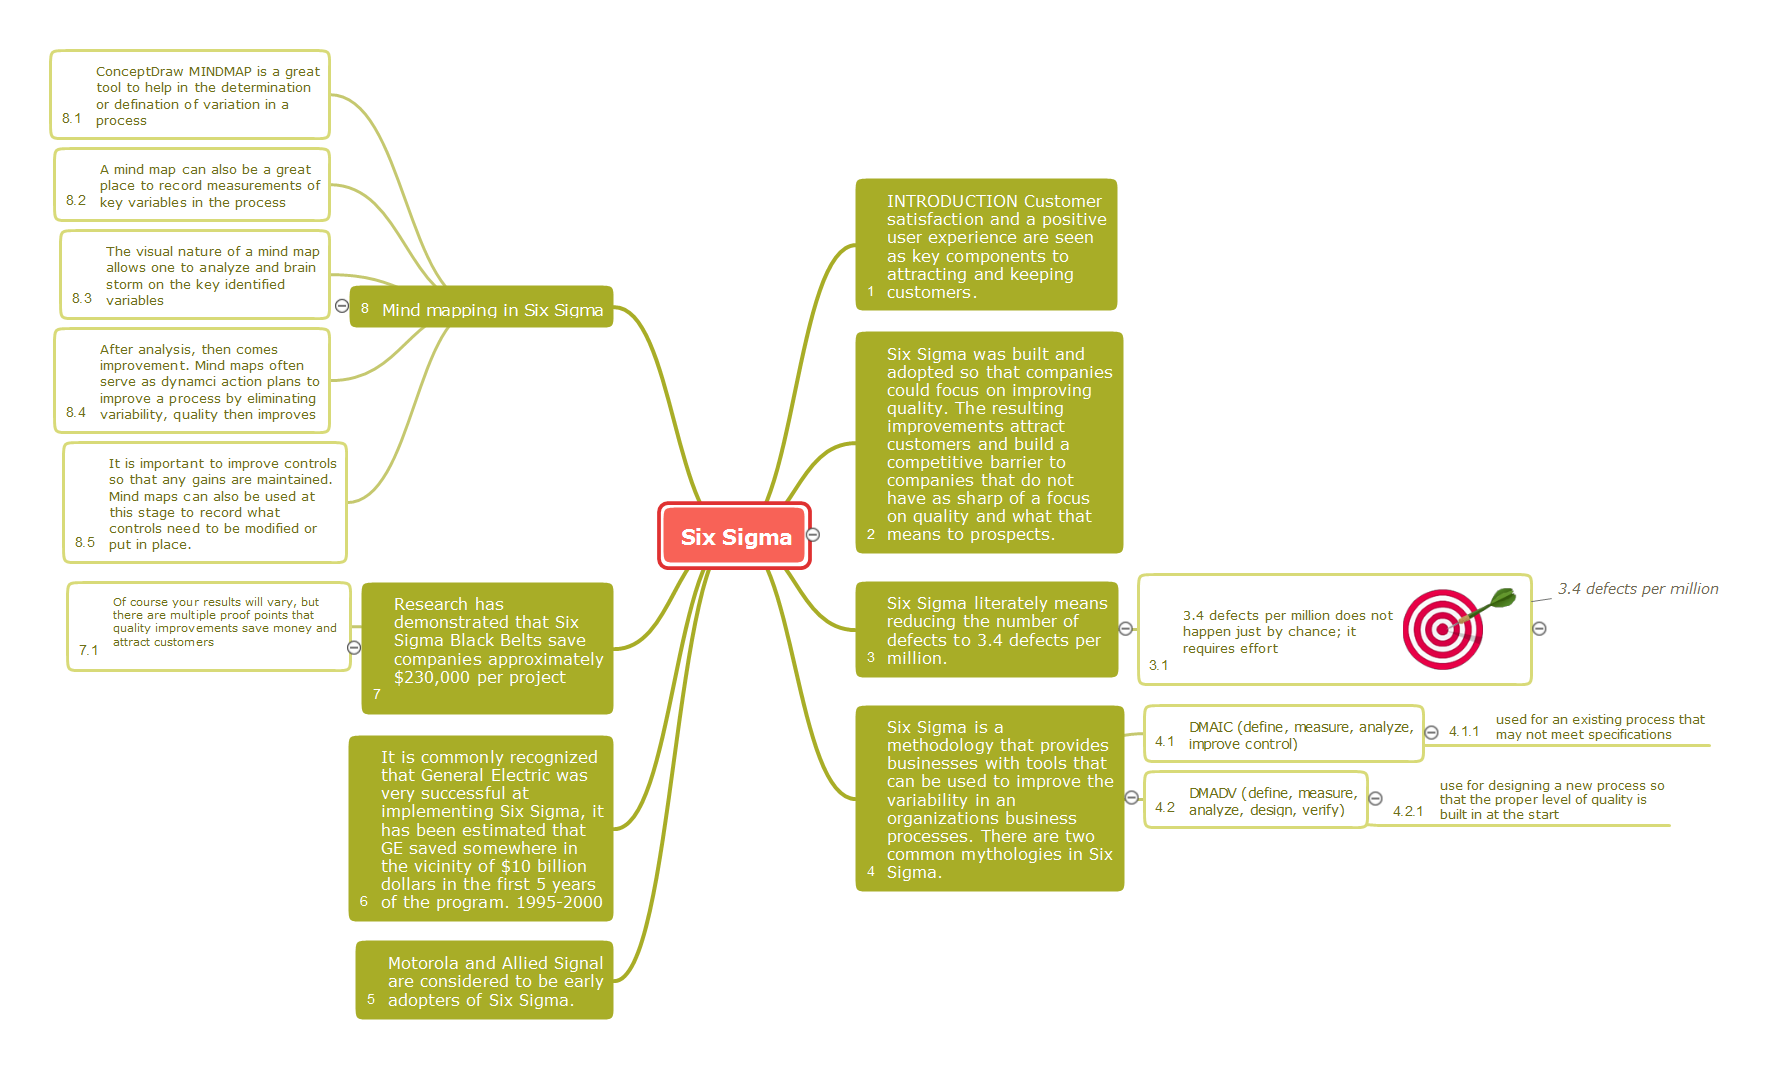
6 Sigma is a popular management concept aimed at improving the quality of work of an organization or individual units and at continuous perfection the processes. The improvement of organization's activities may be executed through the radical changes or in consequence to minor regular improvements. The main purposes of these improvements may be increasing of product safety, improvement quality, decreasing the quantity of defects, shorter the manufacturing cycle, improvement the workplaces, reducing costs, etc. Currently, Six Sigma is applied by organizations of various activity spheres, from the industrial enterprises to the banks. 6 Sigma uses a set of different tools of quality for realizing the improvements and control the processes. Each organization applies its own set of tools, such as Pareto chart, Ishikawa diagram, Tree diagram, etc. Solutions from the Quality area of ConceptDraw Solution Park support quality and manufacturing managers with powerful visualization tools for production quality control and improvement, and supply the ConceptDraw MINDMAP software with Quality Management Mind Maps. This map illustrates how the Six Sigma methodology can be represented as a Mind Map.Customer Relationship Management
Customer relationship management is an important component of sales success. Visualizing sales data you may put some KPI related to customers relationship management to your Sales dashboard and track this important aspect in real time.Quality Control
Using mind mapping for quality management is a creative approach that allows one to structure all key quality points on the one page.Sales Dashboards for Your Company
ConceptDraw DIAGRAM software extended with the Sales Dashboard solution allows you produce sales dashboards for your company easily. You can start from samples and templates delivered with the solution and then modify them to get a dashboard that suites your specific needs.- Total Quality Management Value | Probability Quality Control Tools ...
- TQM Diagram — Professional Total Quality Management | Constant ...
- Affinity diagram - Implementing continuous process improvement ...
- Affinity diagram - Implementing continuous process improvement ...
- Constant improvement of key performance indicators | Performance ...
- How To Make the Right Decision in Projects | Quality Management ...
- Systems engineering improvement | Active Directory Diagrams ...
- Mind Mapping in the Quality Management | Quality Control ...
- PROBLEM ANALYSIS. Root Cause Analysis Tree Diagram | Affinity ...
- Total Quality Management Value | Fishbone Diagram | 4ms Of ...
- Affinity Diagram | Affinity Diagram Software | Affinity diagram ...
- Total Quality Management Value | Improving Problem Solving and ...
- New Quality Solutions for ConceptDraw PRO v9 and ConceptDraw ...
- 6 sigma | Quality Mind Maps - samples and templates | Quality ...
- Quality Project Management with Mind Maps | Mind Map - Quality ...
- Affinity Diagram | Affinity diagram - Implementing continuous ...
- Total Quality Management Value | Manufacturing 8 Ms fishbone ...
- Business Process Improvement Wiki
- The Best Tool for Business Process Modeling | PROBLEM ...
