6 sigma
QualityIn Solutions from Quality Management Area we support quality and manufacturing managers with visualization tools for production quality control and improvement. The solutions from Quality Management Area extend ConceptDraw DIAGRAM software with Quality Diagrams. Quality mind mapsThis solution extends ConceptDraw MINDMAP software with Quality Management Mind Maps (Presentations, Meeting Agendas, Problem to be solved). |
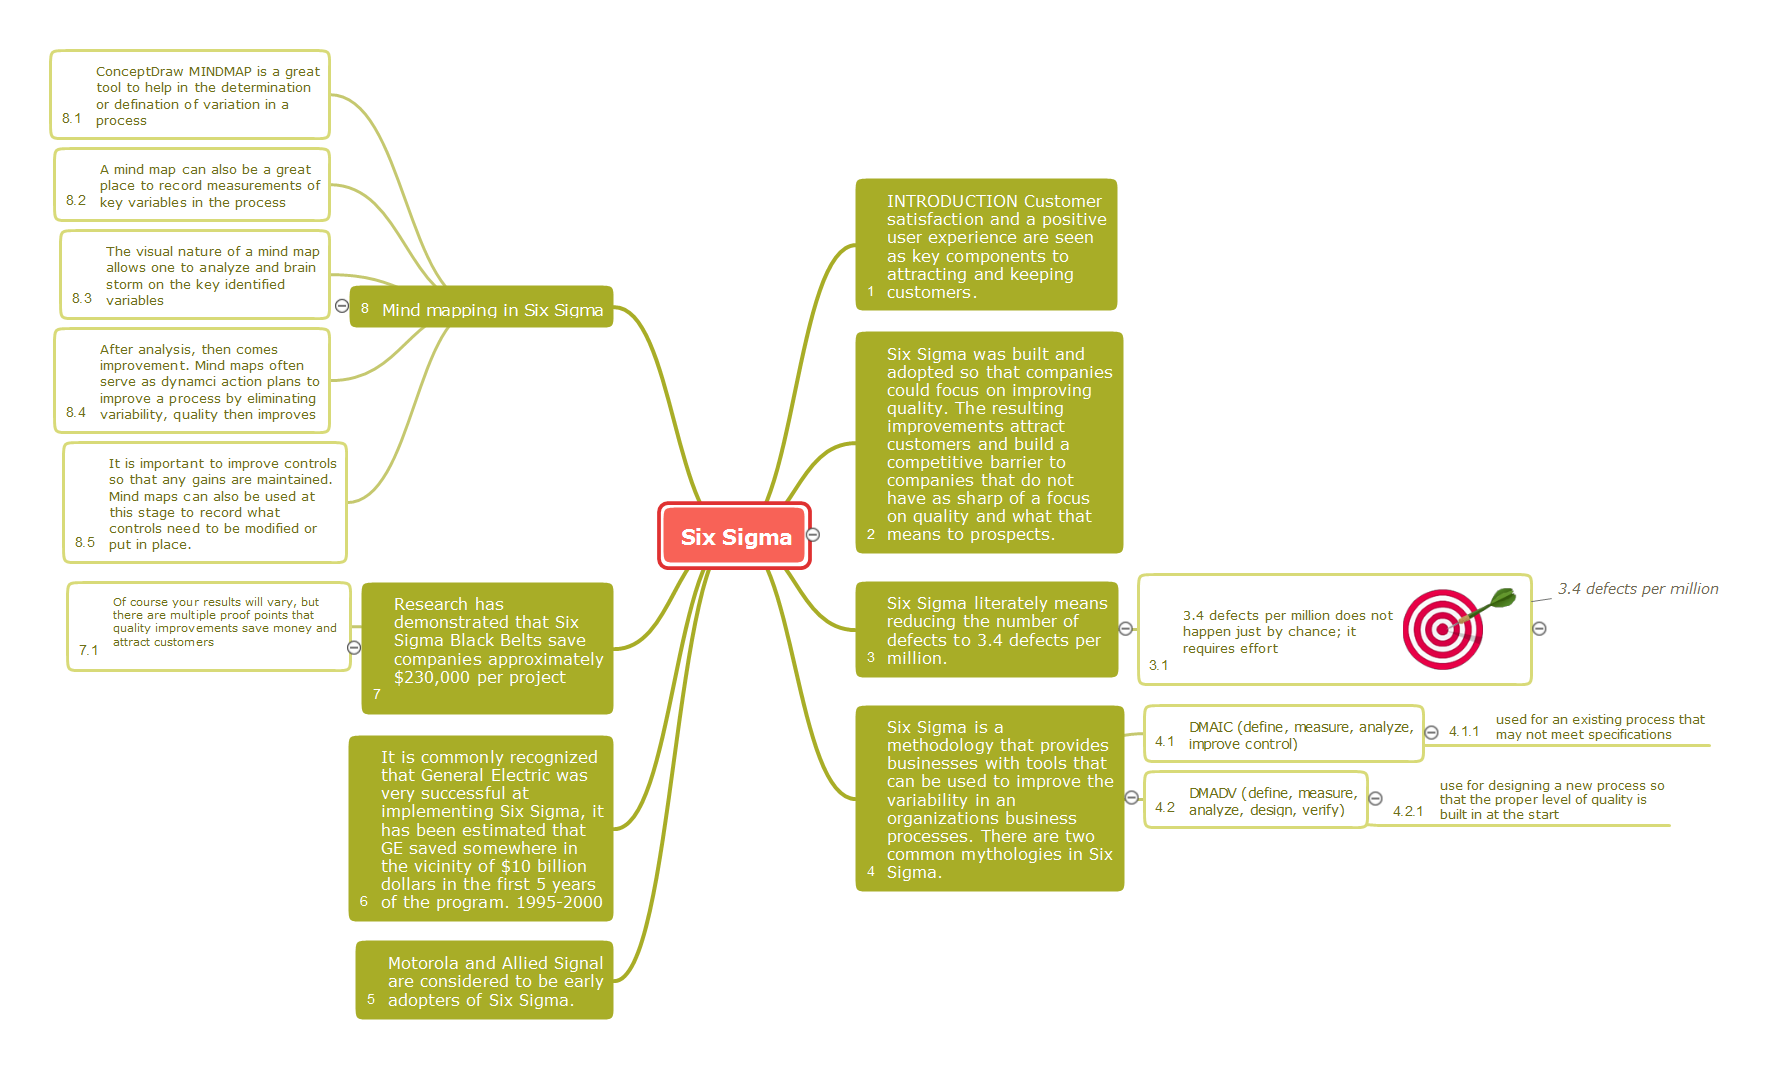
This mind map shows how Six Sigma methodology be represented as a mind map. Six Sigma is a quality management methodology allows reducing the number of defects to 3.4 defects per million.
Example 1. 6 sigma
Export to Outline
Six Sigma
- INTRODUCTION Customer satisfaction and a positive user experience are seen as key components to attracting and keeping customers.
- Six Sigma was built and adopted so that companies could focus on improving quality. The resulting improvements attract customers and build a competitive barrier to companies that do not have as sharp of a focus on quality and what that means to prospects.
-
Six Sigma literately means reducing the number of defects to 3.4 defects per million.
-
3.4 defects per million does not happen just by chance; it requires effort
- 3.4 defects per million
-
3.4 defects per million does not happen just by chance; it requires effort
-
Six Sigma is a methodology that provides businesses with tools that can be used to improve the variability in an organizations business processes. There are two common mythologies in Six Sigma.
-
DMAIC (define, measure, analyze, improve control)
- used for an existing process that may not meet specifications
-
DMADV (define, measure, analyze, design, verify)
- use for designing a new process so that the proper level of quality is built in at the start
-
DMAIC (define, measure, analyze, improve control)
- Motorola and Allied Signal are considered to be early adopters of Six Sigma.
- It is commonly recognized that General Electric was very successful at implementing Six Sigma, it has been estimated that GE saved somewhere in the vicinity of $10 billion dollars in the first 5 years of the program. 1995-2000
-
Research has demonstrated that Six Sigma Black Belts save companies approximately $230,000 per project
- Of course your results will vary, but there are multiple proof points that quality improvements save money and attract customers
-
Mind mapping in Six Sigma
- ConceptDraw MINDMAP is a great tool to help in the determination or defination of variation in a process
- A mind map can also be a great place to record measurements of key variables in the process
- The visual nature of a mind map allows one to analyze and brain storm on the key identified variables
- After analysis, then comes improvement. Mind maps often serve as dynamci action plans to improve a process by eliminating variability, quality then improves
- It is important to improve controls so that any gains are maintained. Mind maps can also be used at this stage to record what controls need to be modified or put in place.
The Benefits for ConceptDraw MINDMAP Brainstorming Software
- ConceptDraw MINDMAP is effective for brainstorming, designing mind maps, idea generating, creative and lateral thinking, creativity and problem solving.
- ConceptDraw MINDMAP is ideal for team and personal work in Business, Marketing and Project Management.
- The libraries with large quantity of vector objects help to illustrate your mind maps and to make them bright, visual and comprehensible.
- Use of View Navigator tool lets create presentations from a mind map: you can simply select the map parts you want to present, sequence your slides, and preview the presentation.
- ConceptDraw MINDMAP provides wide capabilities of importing and exporting in various formats: Microsoft PowerPoint, Microsoft Word, MS Excel, Mindjet MindManager, image, HTML, PDF file.
SEVEN RELATED HOW TO's:
ConceptDraw MINDMAP has impressive import and export capabilities includes following formats:
OPML
Mindjet™ MindManager™
Microsoft™ Office products:
PowerPoint™
Project™
Word™
FreeMind (import only)
XMind (import only)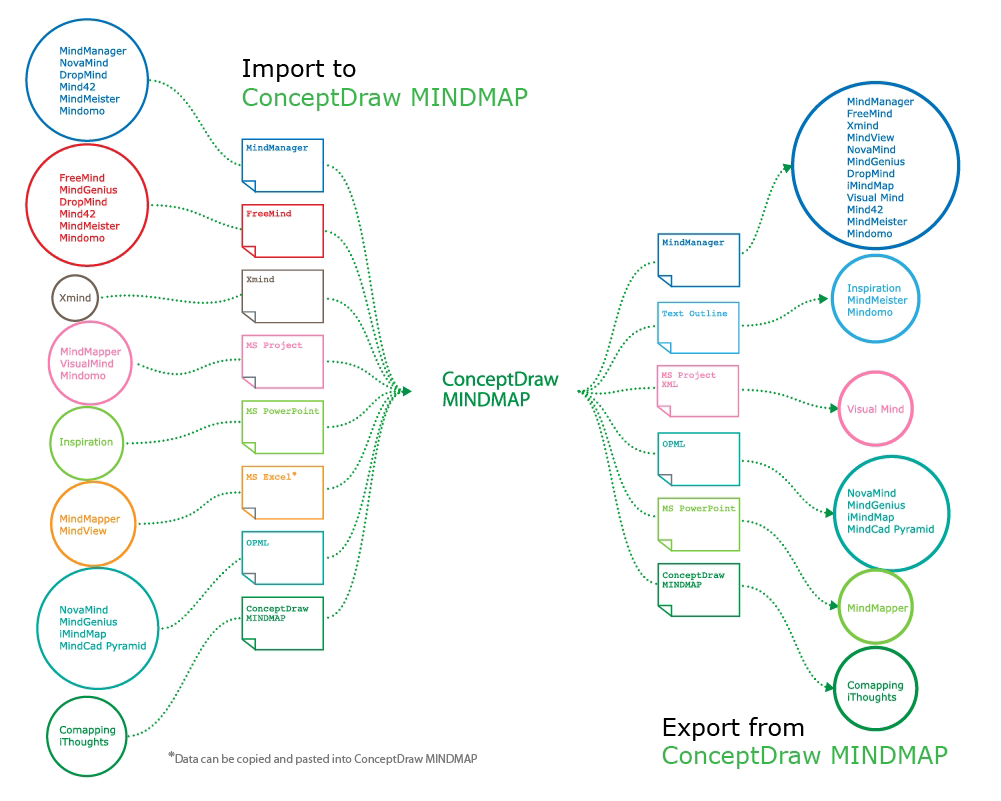
Picture: How to Exchange ConceptDraw MINDMAP Files with Mindjet MindManager
Related Solution:
Represent a set of planned outcomes that define 100% of the project scope. Create Work Breakdown Structure (WBS) diagram.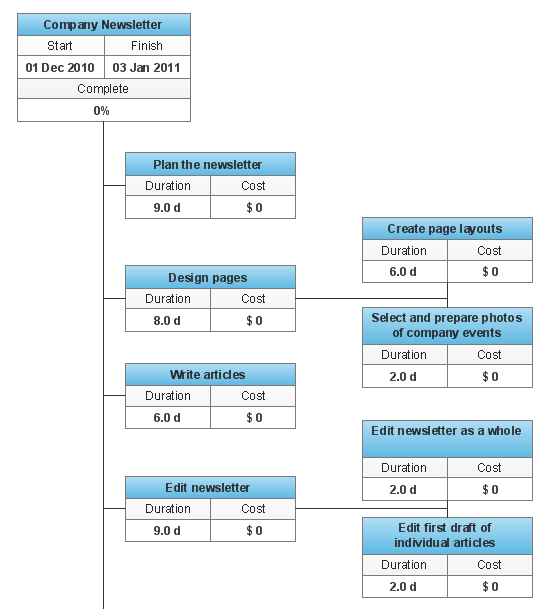
Picture: WBS Diagram
Related Solution:
To support you in your tasks you can use the power of ConceptDraw DIAGRAM providing
intelligent vector graphics that are useful for marketing diagramming and
ConceptDraw MINDMAP for key marketing mind maps.
Picture: Business Productivity - Marketing
Related Solution:
Use the advantages of hierarchical tree structure of mind map while developing the organizational structure of your organization. Create an Organizational Chart from your map. Double click the icon to create an Organizational Chart.
The diagram is created automatically from the active page of your map by ConceptDraw DIAGRAM and will be opened in Slideshow mode.
Picture: Organizational Chart
Related Solution:
My friend works as a marketologist. Once he asked me about Marketing and Sales Organization chart, as it was new for him. Luckily, ConceptDraw Solution Park has tons of examples to show to an unexperienced user.
This organizational chart was designed with ConceptDraw DIAGRAM and its Organizational Charts solution, that can be find in the Management section of Solution Park. This solution offers a vector objects library and a set of samples and templates. The vector library contains symbols and icons that provide you with possibility to show the organizational structure of your organization at a glance. It allows to depict the interrelations of authority and responsibility between positions in an organization. Organizational charts provide both employers and employees a clear view of the sale and marketing departments structure, reporting system, management levels.
Picture: Marketing and Sales Organization chart.Organization chart Example
Related Solution:
The Total Quality Management Diagram solution helps your organization visualize business and industrial processes. Create Total Quality Management diagrams for business process with ConceptDraw software.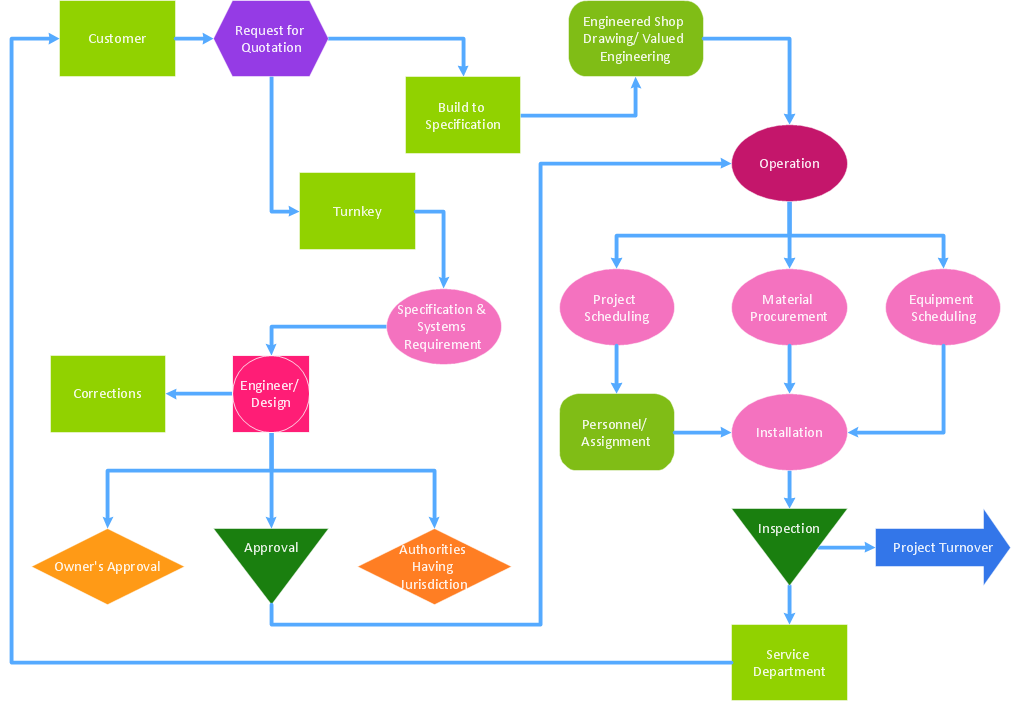
Picture: A Study of the Business Value of Total Quality Management
Related Solution:
Mind map template of a strategy map that can help you display a variety of performance measures that can have an impact on your organization.
Picture: SWOT Analysis
Related Solution:
ConceptDraw
MINDMAP 16