PROBLEM ANALYSIS. Root Cause Analysis Tree Diagram
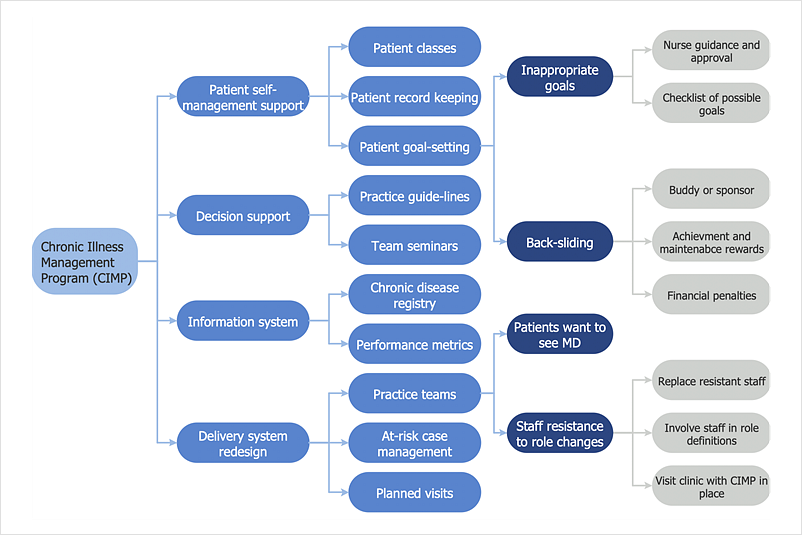
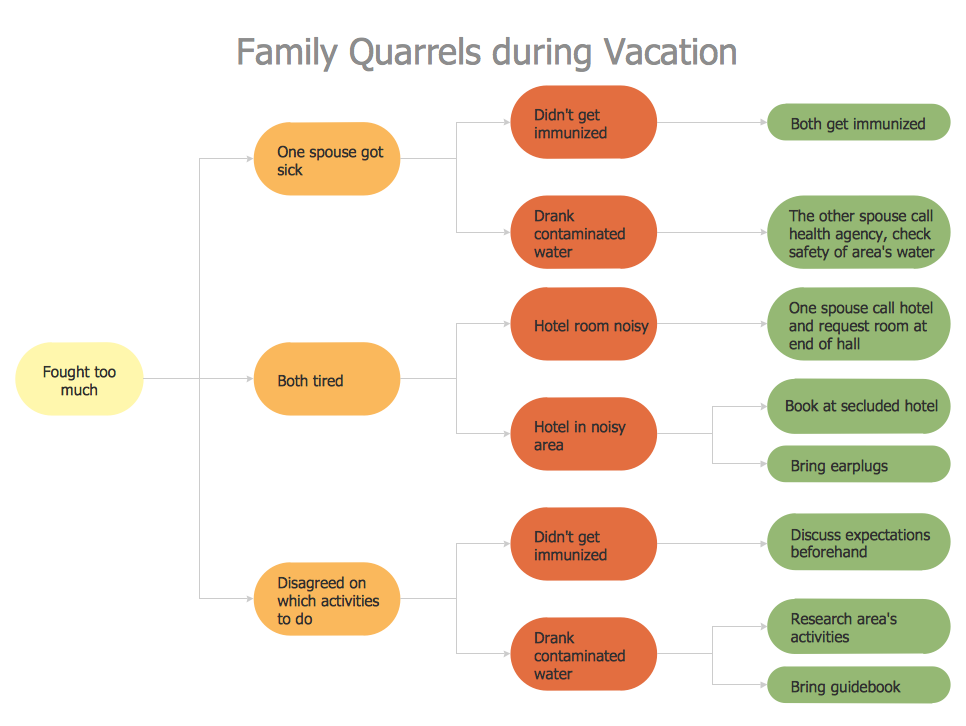
Root Cause Analysis Tree Diagram. Use the Root Cause Diagram to perform visual root cause analysis. Root Cause Analysis Tree Diagram is constructed separately for each highly prioritized factor. The goal of this is to find the root causes for the factor and list possible corrective action. ConceptDraw Office suite is a software for problem analysis.
Visual Presentations Made Easy with Diagramming Software
Automatically create a presentation-quality diagram in one click with ConceptDraw DIAGRAM.
HelpDesk
How to Manage Problem Solving Using Seven Management and Planning Tools
Stage by stage gouide on using visual tools to move toward solving the problem.
The Action Plan
Action Plan - For the action planning define people and groups involvement in corrective actions by roles, identify logical sequences of scheduled actions and critical path of problem solving, identify possible risks of action plan and propose preventive actions. ConceptDraw Office suite is a software for decision making and action plan.
TQM Diagram — Professional Total Quality Management
The Total Quality Management Diagram solution helps you and your organization visualize business and industrial processes. Create Total Quality Management diagrams for business process with ConceptDraw software.TQM Diagram Tool
The Total Quality Management Diagram solution helps you and your organization visualize business and industrial processes. Create Total Quality Management diagrams for business process with ConceptDraw software.7 Management & Planning Tools
The 7 Management and Planning Tools solution available from ConceptDraw Solution Park implements well-known methodologies and provides the comprehensive set of tools for problems' analysis and solving. Different products from multifunctional ConceptDraw Office suite may be used as a complete solution for any of methodologies offered by this solution and provide a visual communication during every stage of work. Use the MINDMAP 7 Management & Planning Tools for step-by-step identification and analysis the problems, for planning solving and corrective actions, and also countermeasures to address the risks. 7 Management and Planning Tools solution is perfect for managers in medium to large companies, who require effective tools to address the management issue, for business consultants, trainers and coaches to help visualize the problem's solving by using 7 MP Tools methodology, to structure the problem's affecting factors, analyze their root causes and cause and effect relations, to highlight drivers and indicators factors, to prioritize factors using ranking by criteria set.EPC for Configuring an Enterprise Resource Planning
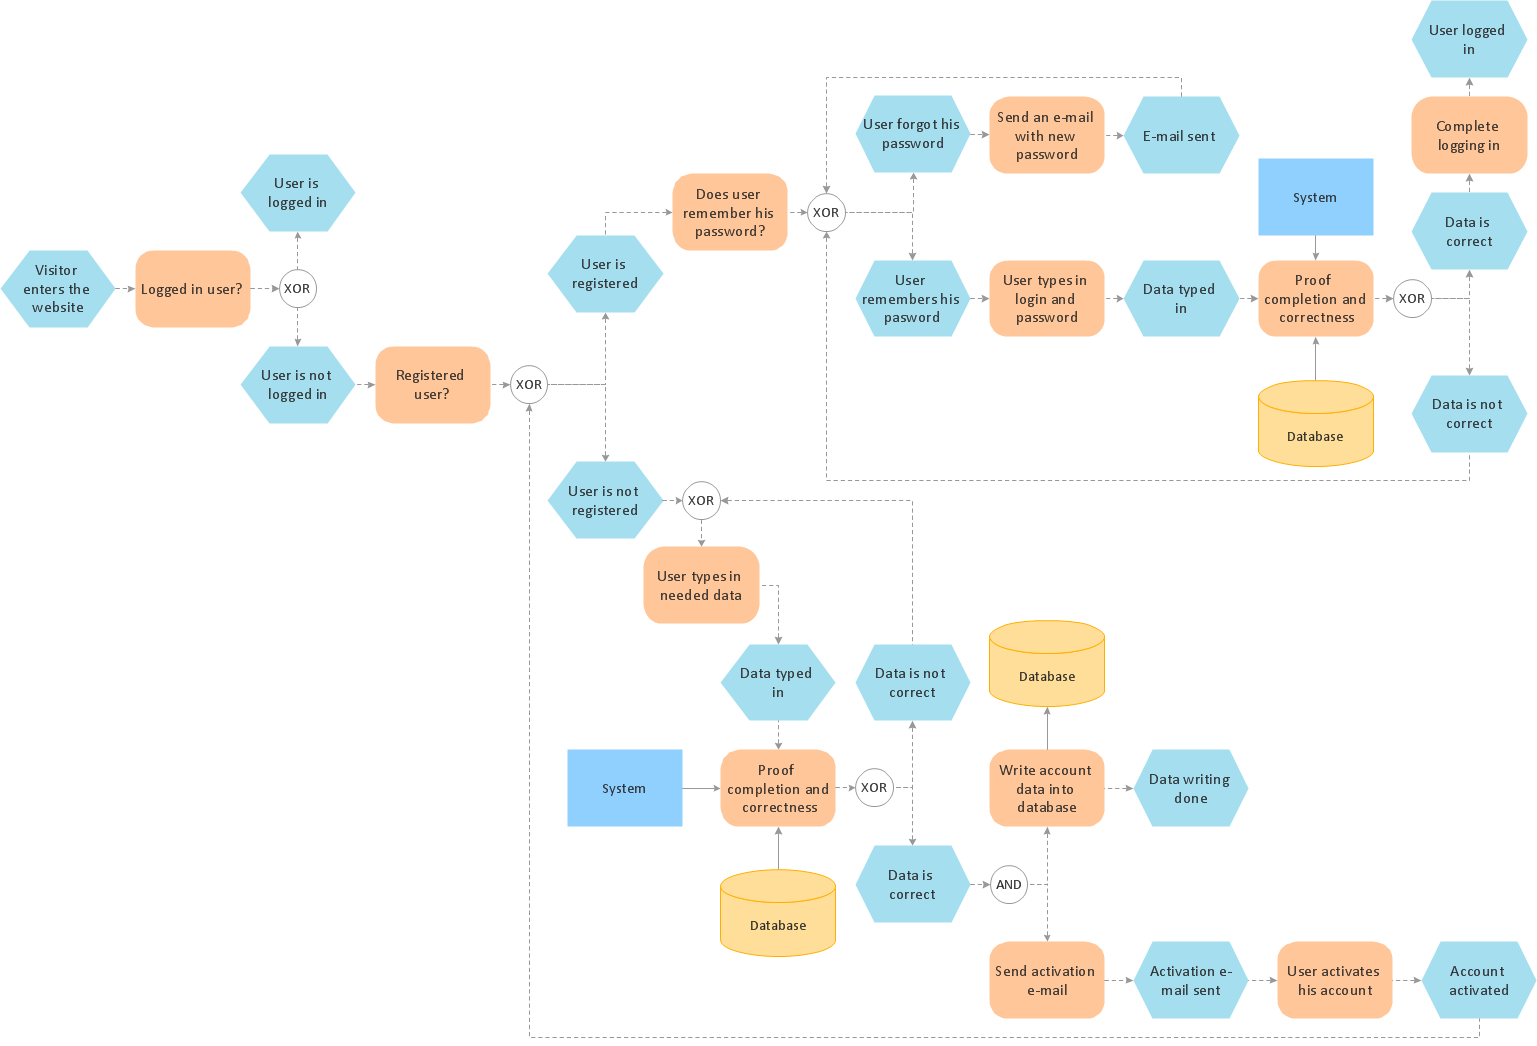
Event-Driven Process Chain Diagrams for improvement throughout an organisation. ConceptDraw DIAGRAM - software that reduces the time needed to create a business process model.The Building Blocks Used in EPC Diagrams
Event-Driven Process Chain Diagrams is using for improvement throughout an organisation. ConceptDraw DIAGRAM - software that reduces the time needed to create a EPC diagrams.Root Cause Analysis
The Seven Management and Planning Tools is a tool for Root Cause Analysis Tree Diagram drawing. This diagram is for Root Cause Analysis. Analyze the root causes for factors that influenced the problem. This diagram is constructed separately for each highly prioritized factor. The goal of this is to find the root causes for the factor and list possible corrective action.
Root Cause Analysis
The Seven Management and Planning Tools is a tool for Root Cause Analysis Tree Diagram drawing. This diagram is for Root Cause Analysis. Analyze the root causes for factors that influenced the problem. This diagram is constructed separately for each highly prioritized factor. The goal of this is to find the root causes for the factor and list possible corrective action.
Process Modelling using Event-driven Process chain
Event-Driven Process Chain Diagrams for improvement throughout an organisation. ConceptDraw DIAGRAM - business process mapping software that reduces the time needed to create a business process model and its excellent business process improvement tools.Relationships Analysis
Relationships Analysis. Relations Diagram - factors analysis, factors relations. Create Relations Diagram with ConceptDraw DIAGRAM. The Seven Management and Planning Tools is a tool for Interaction diagram drawing. This diagram identifies causal relationships. Determine what factors are causes and which factors are effects. Interaction diagram helps establish KPIs to monitor changes and the effectiveness of corrective actions in resolving the problem.
TQM Software — Build Professional TQM Diagrams
The Total Quality Management Diagram solution helps you and your organization visualize business and industrial processes. Create Total Quality Management diagrams for business process with ConceptDraw software.Social Media Response Management DFD Charts - software tools
ConceptDraw is your tool for driving social integration and managing change across and streamline social media processes of your organisation.This tool keeps the entire team on the same page allowing you to realize your social media strategy, improve the quality of your answers, and minimize the time it takes to respond.
Problem solving
Problem Solving - ConceptDraw Office suite is a software for the problem solving. The Seven Management and Planning Tools solution is a set of such tools for investigating complex problems. These tools are exemplary at organizing research, parsing complex problems, providing a structure for the details, helping managers make decisions, and organizing effective communications in a visual manner that keeps everyone involved.
Quality Management Teams
ConceptDraw MINDMAP with Quality mindmaps solution as a demonstration of the creative approach to quality management in daily work of quality management team.Management Tools — Total Quality Management
The Total Quality Management Diagram solution helps your organization visualize business and industrial processes. Create Total Quality Management diagrams for business process with ConceptDraw software.Activity Network (PERT) Chart
Activity Network and Project Evaluation and Review Technique, or PERT, charts are a way of documenting and analyzing the tasks in a project. This diagram is constructed as part of the process in creating a schedule of corrective actions. The Activity Network Chart (PERT) shows the logical connections and consequence of tasks to be performed. It displays the time period for problem solving and the implementation of all activities through the critical path.Business Productivity - Management
The widespread of Mind Maps in the field of management is justified and very convenient. The managers and leaders work with large amount of information and data, and need the useful tools for its structuring and systemizing. They prefer to use the powerful Mind Mapping software that gives them a lot of benefits. ConceptDraw MINDMAP is professional software for management, business planning, strategic planning, business productivity and development. It provides the powerful tools which help managers to be effective and improve their productivity, supports them in easy visual documenting and communication the management information. Use ConceptDraw MINDMAP to build the Management Diagrams (Matrices, Organizational Charts, Deployment Charts, Timelines, Cause & Effect (Fishbone) Diagrams) and key management Mind Maps (SWOT analysis, problem solving, decision making, business planning, scheduling, thinking ideas, company organizing, preparing and holding the meetings and presentations) quickly and easily.- Process Flowchart | 7 Management & Planning Tools | Decision ...
- Business Board Org Chart | Property Management Examples | Ice ...
- Process Flowchart | Visual Controls Applying Visual Management ...
- Seven Management and Planning Tools | PROBLEM ANALYSIS ...
- What Are Problem Solving New Management Tools
- 7 Management & Planning Tools | Seven Management and ...
- Basic Flowchart Symbols and Meaning | Types of Flowcharts | Lean ...
- Schedule pie chart - Daily action plan | Prioritization Matrix | Pyramid ...
- Basic Flowchart Symbols and Meaning | Process Flowchart | Basic ...
- Emergency management exercise cycle | Visual Presentations ...
- Emergency management exercise cycle | Visual Presentations ...
- Quality Management Tools | TQM Tools | Management Tools ...
- Visual Presentations Made Easy with Diagramming Software ...
- Seven Management and Planning Tools | 7 Management ...
- Press Releases - ConceptDraw
- Visual Presentations Made Easy with Diagramming Software ...
- Daily Infographic | Infographic Examples | Management Tools | Daily ...
- Project Management Area | Gantt Chart Software | How to Track ...
- Probability Quality Control Tools | Total Quality Management ...


