Daily Infographic
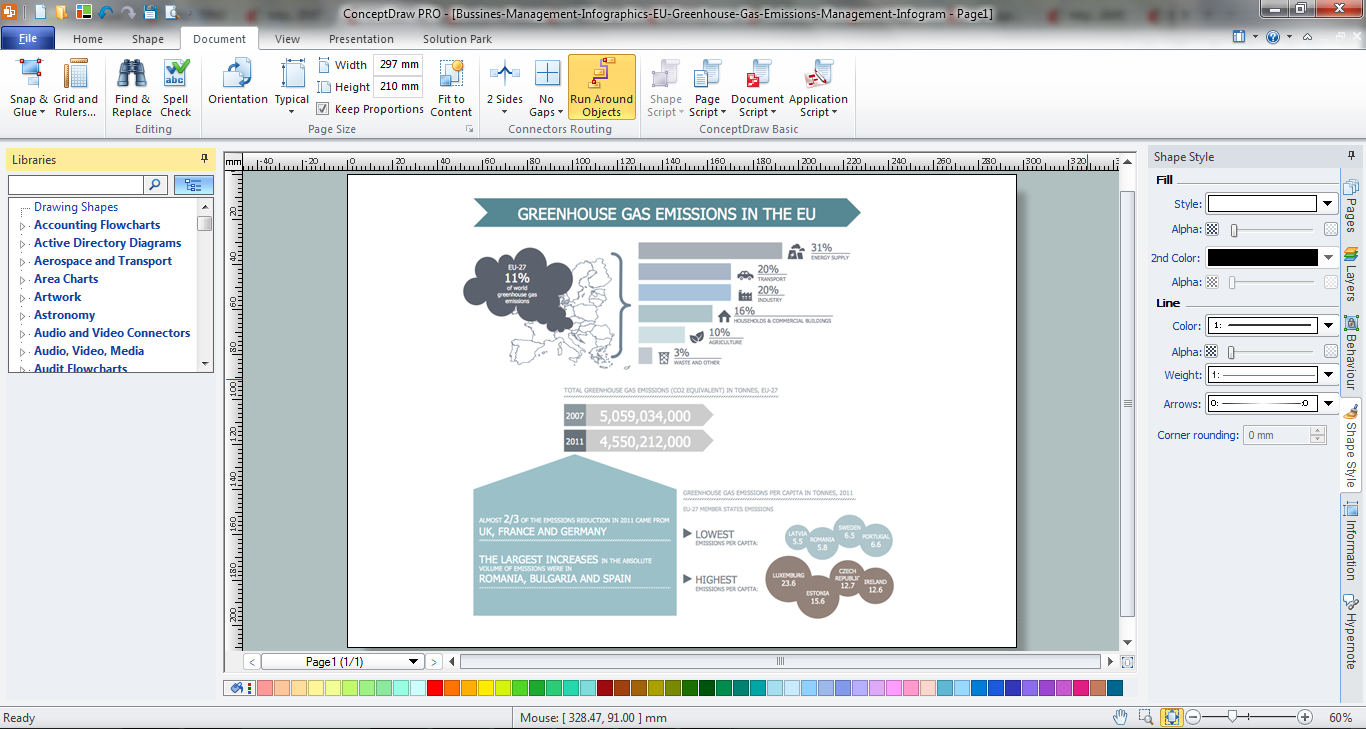
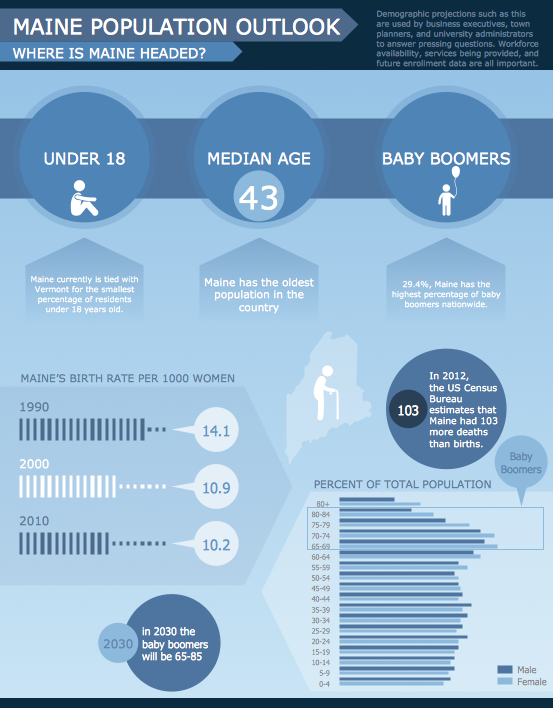
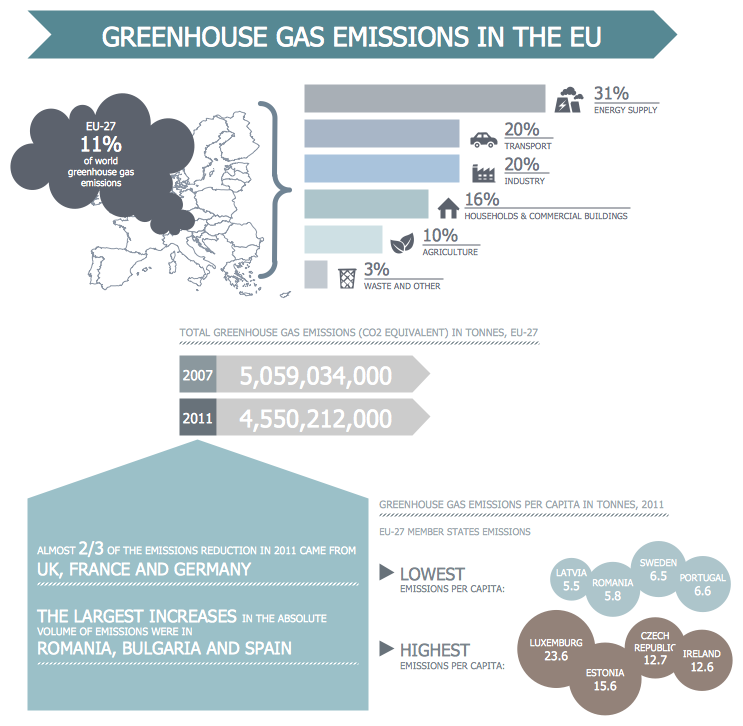
It's impossible to imagine our life without infographics! They are very popular in many fields of science, work and life activity. Management infographics, daily infographic are the good way for representing various information, complex knowledge in a visual comprehensive form. Try design them quick, easy and effective with new powerful Management Infographics Solution from the Business Infographics Area for ConceptDraw Solution Park.Infographic Examples
Never before creation of management infographics wasn’t so easy as now thanks to the Management Infographics Solution from the Business Infographics Area for ConceptDraw Solution Park. This solution offers extensive drawing tools and also unique collection of professionally designed infographic examples.Management Tools
The science of the modern world does not stand still and is developing very fast.Day by day management specialists need the more effective and modern management tools. ConceptDraw PRO diagramming and vector drawing software provides the unique Management Infographics Solution from the Business Infographics Area with extensive management tools.
Management Consultant
A management consultant is an important person for the company, he helps in the questions of improving business performance and increasing profits, he consults for the questions of business strategy, management and financial controls, resources, and also suggests recommendations for changing the structure of the company if needed.
So, every day management consultant conduct the complex work and often use the helpful management infographics for explain his thoughts and arguments to the company direction. Thanks to the development of computer technologies, drawing of management infographics is so easy today. ConceptDraw PRO diagramming and vector drawing software offers you the Management Infographics Solution from the Business Infographics Area.
 PM Dashboards
 PM Planning
How to Use ConceptDraw Dashboard for Facebook on OS X
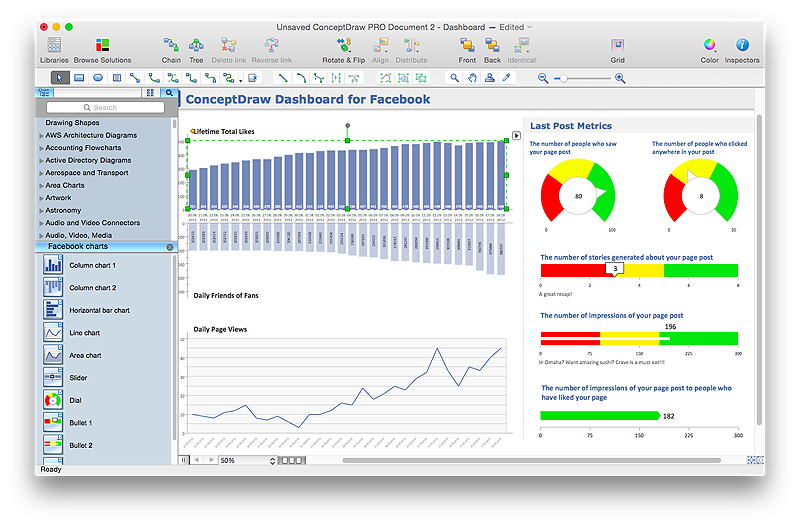
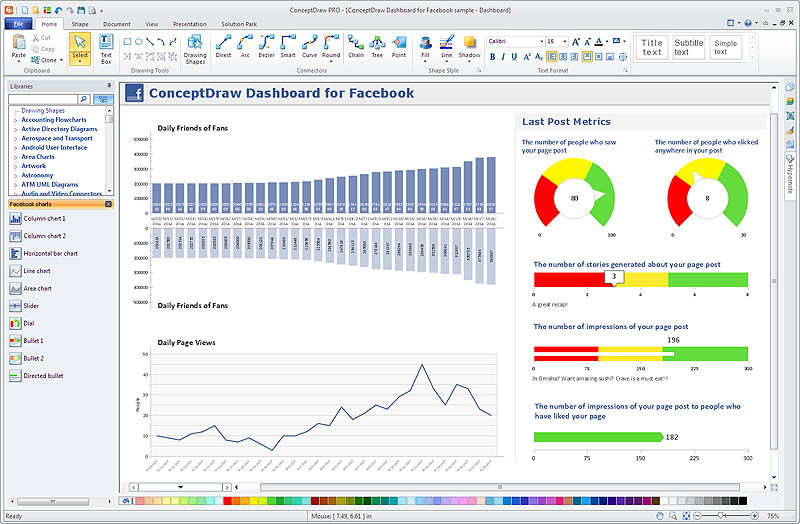
The ConceptDraw Dashboard for Facebook Solution is a visual dashboard that visualizes lifetime total Likes, daily Friends of Fans, and daily Page views based on the information exported from your Facebook Page.How to Create a Bar Chart in ConceptDraw PRO
Bar charts (bar graphs) are diagrams displaying data as horizontal or vertical bars of certain heights.Bar charts are widely used to show and compare the values of the same parameters for different data groups.
The bar graph can be vertical or horizontal. This depends on the amount of categories. There are many methods in which bar graph can be built and this makes it a very often used chart type. Usually, a bar chart is created so that the bars are placed vertically. Such arrangement means that the bar's height value is proportional to the category value. Nevertheless, a bar chart can be also drawn horizontally. This means that the longer the bar, the bigger the category. Thus, a bar chart is a good way to present the relative values of different measured items. The ConceptDraw Bar Graphs solution allows you to draw a bar chart quickly using a vector library, containing the set of various bar charts objects.
How to Use ConceptDraw Dashboard for Facebook on PC
The ConceptDraw Dashboard for Facebook Solution is a visual dashboard that visualizes lifetime total Likes, daily Friends of Fans, and daily Page views based on the information exported from your Facebook Page.
 PM Agile
 MindTweet
 ConceptDraw Dashboard for Facebook
 Project Management Area
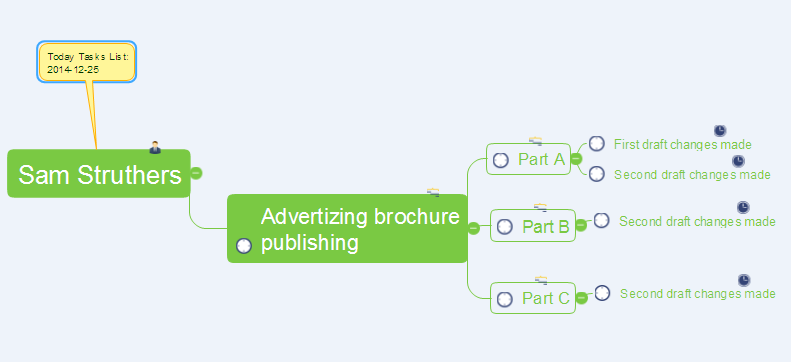
How to Manage a Multiple Project Participants Responsibilities with To-Do Mind Maps
All project participants are kept informed of their responsibilities in projects and can detail their tasks in a creative mind map format.- How to Create Management Infographics Using ConceptDraw PRO ...
- Basic Flowchart Symbols and Meaning | Marketing Plan Infographic ...
- Infographic Generator | Management Tools | Infographic Examples ...
- How to Draw Pictorial Chart. How to Use Infograms | Pictorial Chart ...
- Design Pictorial Infographics . Design Infographics | How to Draw ...
- Daily Project Tracking Report
- Quality Mind Map | Example Explain Graph Of Daily Sales
- Management Consultant | Directions Maps | Maps Driving Directions ...
- Target and Circular Diagrams | Flowcharts | Project Management ...
- Seven Management and Planning Tools | Process Flowchart | Total ...
- Schedule pie chart - Daily action plan | ConceptDraw Solution Park ...
- Schedule pie chart - Daily action plan | Pie Charts | Bar Diagrams for ...
- Illustration | Universal Diagramming Area | Schedule pie chart ...
- Schedule pie chart - Daily action plan | Design elements - Calendars ...
- PM Personal Time Management | Schedule pie chart - Daily action ...
- Target Diagram | Target and Circular Diagrams | Daily Schedule ...
- Schedule pie chart - Daily action plan | Gant Chart in Project ...
- Target Diagram | Target and Circular Diagrams | Daily Schedule ...
- Target and Circular Diagrams | Target Diagram | Daily Schedule ...
