The Sales Process

 CRM Center Dashboard
The CRM Center Dashboard solution extends ConceptDraw DIAGRAM functionality with CRM software tools, large collection of CRM Charts live objects, CRM icons, CRM indicators, CRM maps and navigation elements, the set of professionally designed CRM samples and templates to help you construct your own CRM Dashboards and CRM Center Dashboards in a few minutes, to depict the current and actual data by connecting or refreshing the data source file. The customer management software ConceptDraw DIAGRAM makes you free to choose the style for your dashboard and to regulate the quantity of clipart on the diagram according to your taste.
Data Flow Diagram Process

How to Present a Social Media Response Plan DFD to Your Team

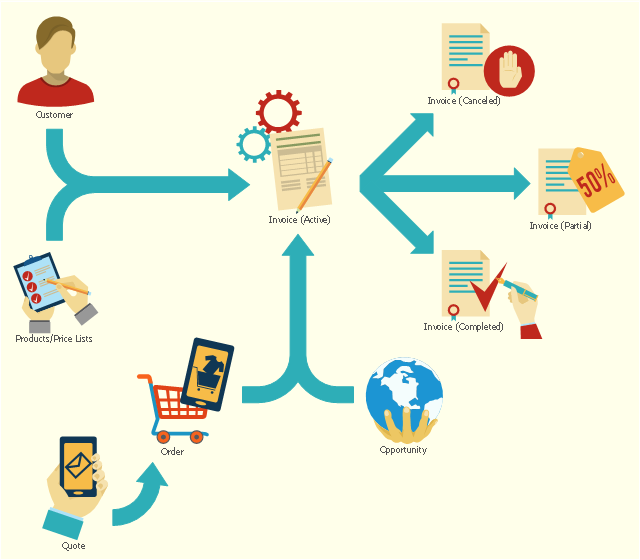
This flowchart example shows the lifecycle of an invoice in Microsoft Dynamics CRM. It was redesigned from the Wikimedia Commons file: Invoice lifecycle.svg. [commons.wikimedia.org/ wiki/ File:Invoice_ lifecycle.svg]
"Microsoft Dynamics CRM is a customer relationship management software package developed by Microsoft. Out of the box, the product focuses mainly on Sales, Marketing, and Service (help desk) sectors...
Dynamics CRM is a server-client application, which, like Microsoft SharePoint, is primarily an IIS-based web application which also supports extensive web services interfaces. Clients access Dynamics CRM either by using a Browser or by a thick client plug-in to Microsoft Outlook." [Microsoft Dynamics CRM. Wikipedia]
The process flowchart example "Invoice lifecycle" was created using the ConceptDraw PRO diagramming and vector drawing software extended with the Sales Flowcharts solution from the Marketing area of ConceptDraw Solution Park.
Lifecycle of an invoice in Microsoft Dynamics CRM
DFD Library — Design elements

Data Flow Diagram

Example of DFD for Online Store (Data Flow Diagram)


How to Create a Social Media DFD Flowchart

Data Flow Diagrams

Marketing and Sales Organization chart. Organization chart Example

UML Class Diagram Tutorial

DFD Flowchart Symbols

Data Flow Diagram Model

Taxi Service Data Flow Diagram DFD Example

 Marketing Diagrams
Marketing Diagrams solution extends ConceptDraw DIAGRAM diagramming software with abundance of samples, templates and vector design elements intended for easy graphical visualization and drawing different types of Marketing diagrams and graphs, including Branding Strategies Diagram, Five Forces Model Diagram, Decision Tree Diagram, Puzzle Diagram, Step Diagram, Process Chart, Strategy Map, Funnel Diagram, Value Chain Diagram, Ladder of Customer Loyalty Diagram, Leaky Bucket Diagram, Promotional Mix Diagram, Service-Goods Continuum Diagram, Six Markets Model Diagram, Sources of Customer Satisfaction Diagram, etc. Analyze effectively the marketing activity of your company and apply the optimal marketing methods with ConceptDraw DIAGRAM software.
 Data Flow Diagrams (DFD)
Data Flow Diagrams solution extends ConceptDraw DIAGRAM software with templates, samples and libraries of vector stencils for drawing the data flow diagrams (DFD).
Design Data Flow. DFD Library

How to Connect Social Media DFD Flowchart with Action Maps

Total Quality Management Business Diagram

- Data Flow Diagram For Customer Relationship Management
- Data Flow Diagrams ( DFD ) | CRM Center Dashboard ...
- Dfd For Customer Relationship Management System
- Data Flow Diagram For Customer Relationship Management System
- Data Flow Diagram For Crm System
- Sales Process Flowcharts | Sales Flowcharts | Crm Cycle Process Dfd
- Invoice lifecycle | Sales Flowcharts | Marketing Diagrams | How To ...
- Crm Data Flow Diagram
- Social Media Response Management DFD Charts - software tools ...
- IDEF0 Diagrams | Data Flow Diagrams ( DFD ) | IDEF Business ...
- Entity- Relationship Diagram (ERD) | How to Help Customers be ...
- System Flowchart For Crm
- IDEF Business Process Diagrams | Data Flow Diagrams ( DFD ...
- Business diagrams & Org Charts with ConceptDraw DIAGRAM | Crm ...
- CRM Center Dashboard | How To Create a CRM System Dashboard ...
- Crm Flow Chart
- Crm Flowchart
- Visual shopping scheme | Example of DFD for Online Store ( Data ...
- Design Data Flow. DFD Library | Lead to opportunity sales flow ...
- Dashboard Management Software