Example of DFD for Online Store (Data Flow Diagram)
Data Flow Diagram (DFD) is a methodology of graphical structural analysis and information systems design, which describes the sources external in respect to the system, recipients of data, logical functions, data flows and data stores that are accessed. DFDs allow to identify relationships between various system's components and are effectively used in business analysis and information systems analysis. They are useful for system’s high-level details modeling, to show how the input data are transformed to output results via the sequence of functional transformations. For description of DFD diagrams are uses two notations — Yourdon and Gane-Sarson, which differ in syntax. Online Store DFD example illustrates the Data Flow Diagram for online store, the interactions between Customers, Visitors, Sellers, depicts User databases and the flows of Website Information. ConceptDraw DIAGRAM enhanced with Data Flow Diagrams solution lets you to draw clear and simple example of DFD for Online Store using special libraries of predesigned DFD symbols.
Data Flow Diagram (DFD)
A Data Flow Diagram (DFD) illustrates the flow of data through an information system, visualizes how the information is handled in terms of inputs and outputs, how the data enter to system and leave it. It is effective to use a Data Flow Diagram for creation the system's overview, to show the system's scope and boundaries. There are two different types of notations for DFDs: Yourdon-Coad and Gane-Sarson, which differ in visual representations for processes, data flow, data stores, external entities, etc. Thus, for example the processes are depicted as circles in Yourdon-Coad notation and as rounded squares in Gane-Sarson notation. Gane-Sarson notation is usually used for visualization information systems and Yourdon-Coad - for system analysis and design. The Data Flow Diagrams solution included to Software Development area of ConceptDraw Solution Park offers a lot of DFD templates, samples and examples, libraries of vector stencils for construction without efforts the DFDs according to both Gane-Sarson and Yourdon-Coad notations.Data Flow Diagram Model
Data Flow Diagram (DFD) is a technique of graphical structural analysis, describing the sources external to the system, recipients of data, also logical functions, data flows and data stores that are accessed. The DFD's goal is to show how each process converts its inputs into the outputs and to identify relationships between these processes, at this make the system's description clear and understandable at every level of detail. Historically happened that for describing Data Flow Diagrams are used two notations - Yourdon and Gane-Sarson that differ each from other by graphical representation of symbols. The DFD model, like most other structural models is a hierarchical model. Each process can be subjected to decomposition on the structural components, the relationships between which in the same notation can be shown on a separate diagram. Typically, several DFD models are built when modeling the system. ConceptDraw DIAGRAM software enhanced with Data Flow Diagrams solution ideally suits for creation DFD models and professional drawing Data Flow Diagrams.Data Flow Diagram Process
Data Flow Diagram (DFD) is a hierarchy of functional processes, connected by data flows. The purpose of this presentation is to show how each process converts its inputs into outputs and to identify relationships between these processes. DFD is convenient way of modeling and construction the information processes, it step-by-step illustrates the flow of information in a process. For construction a DFD traditionally are used two different notations, which appropriate to the methods of Yourdon-Coad and Gane-Sarson. These notations slightly different from each other by graphical representation of symbols for processes, data stores, data flow, external entities. When designing a DFD it is required to decompose the system into the components (sub-systems), for explaining a complex system you may need represent numerous levels. The Data Flow Diagrams solution from ConceptDraw Solution Park contains numerous predesigned DFD symbols for both notations, which help easy and effectively design professional-looking Data Flow Diagrams (DFDs) and DFD Process Diagrams.
Data Flow Diagrams (DFD)
Data Flow Diagrams solution extends ConceptDraw DIAGRAM software with templates, samples and libraries of vector stencils for drawing the data flow diagrams (DFD).
Database Flowchart Symbols
Data base diagrams describes inter-related data and tables. It describes roles and relationships, internal and external dependencies, data exchange conventions and structures of knowledge domain. ConceptDraw Software provides number of data-base chart libraries including major 49 vector symbols. Use these DFD flowchart symbol libraries to design data-base structure and models, use it to design data base process-oriented models, or simple data-oriented models. The are special drawing tools for making data flowcharts, data process diagrams, structured analysis diagrams, and information flow diagrams.DFD Library System
The Data Flow Diagram (DFD) is a graphical technique used for effective modeling and analyzing the information processes and systems. Having at the disposal the DFD library system and newest powerful tools of ConceptDraw DIAGRAM diagramming and vector drawing software supplied with Data Flow Diagrams (DFD) solution from the Software Development area of ConceptDraw Solution Park, you can design fast and easy the Data flow diagrams, Data flowcharts, Data flow models, Data flow process diagrams, Process-oriented models, Data-oriented models, Data process diagrams, Structured analysis diagrams, Information flow diagrams of any type and complexity. For designing the Data Flow Diagrams in ConceptDraw DIAGRAM software are used the simple DFD flowchart symbols from the offered DFD libraries - Data Flow Diagram (DFD) library, Yourdon and Coad Notation library, and Gane-Sarson Notation library. The DFD objects are need to be connected each other by the arrows to depict the data flow from one step to another, that you can do in seconds in ConceptDraw DIAGRAM , as well as set desired design of your diagram.Business Process Flow Diagram
Business Process Flow Diagram is a graphical presentation of business processes and process flows. It is one of the main tool of business analysis and business process re-engineering that lets identify and easy understand process flows within organization. ConceptDraw DIAGRAM extended with Business Process Workflow Diagrams solution from the Business Processes area of ConceptDraw Solution Park is a powerful software which lets easy design Business Process Flow Diagram of any complexity.UML Composite Structure Diagram. Design Elements
UML Composite Structure Diagram shows the internal structure of a class and the possible interactions at this structure. ConceptDraw has 393 vector stencils in the 13 libraries that helps you to start using software for designing your own UML Diagrams. You can use the appropriate stencils of UML notation from UML Composite Structure library.Data Flow Diagram
Data Flow Diagram (DFD) is the part of the Structured Systems Analysis and Design Methodology (SSADM), which is intended for information systems projection and analysis. Data Flow Diagrams allow graphically represent the data flows in information system and analyze the data processing during the structural projection. This type of diagrams lets visually show a work of information system and results of this work, it is often used in connection with human processes and can be displayed as Workflow diagram. Data Flow Diagram visualizes processes and functions, external entities, data depositories, and data flows connecting these elements and indicating direction and data character. Each of these elements used for DFD has its own graphical notation. There are two notations to draw DFDs - Yourdon & Coad and Gane & Sarson. ConceptDraw DIAGRAM extended with Data Flow Diagrams (DFD) solution from Software Developmant area is ideal for designing professional looking DFDs, which can be then easily exported in various formats.IDEF0 Flowchart Symbols
The modeling of business and business processes is not quite a simple process for both small-size businesses and large businesses. The IDEF0 method is one of the popular and easy methods of modeling the business as a complex system. It is based on the functional modeling language Structured Analysis and Design Technique (abbr. SADT) and is concentrated on the activity modeling. According to this method are constructed the IDEF0 Diagrams and IDEF0 Flowcharts, which are succesfully used not only for documenting the business, but also for analysis, development, integration of information and software systems, reengineering, etc. This method suggests the use of special IDEF0 Flowchart Symbols from the IDEF0 notation for construction the IDEF0 Flowcharts. ConceptDraw DIAGRAM diagramming and vector graphic software extended with IDEF0 Diagrams solution from the Software Development area of ConceptDraw Solution Park is rich for the powerful drawing tools, built-in templates and samples, and predesigned IDEF0 flowchart symbols.Wireframe Tools
A wireframe is a scheme of a future web page. Wireframe illustrates the web page structure, location and size of the main elements, as well as their interaction with the user. With such scheme designer defines the functionality of the page, not its appearance.Software and Database Design with ConceptDraw DIAGRAM
Unified Modeling Language (abbr. UML) is a modeling language used by software developers and software engineers for developing diagrams, expressive modeling, visualization, construction, specification, and documentation an information about software-intensive systems. There are used many types of UML diagrams, joined in main groups, each of them has its own functional abilities and applications: Behaviour diagrams illustrate the functionality of software systems, Structuring diagrams depict a structure of objects at the systems, Interaction diagrams show the flow of control and data among the things in a modeling system. UML has a lot of practical applications in varied areas, among them software development, hardware design, banking and financial services, telecommunication, science, research, enterprise information system, distributed Web-based services, user interfaces for web applications, medical electronics, patient healthcare systems, etc. ConceptDraw DIAGRAM extended with Rapid UML solution is a perfect tool for UML diagramming.UML Diagram Tool
The UML diagrams are widely used and creating them is useful to apply the automated UML diagram tool. ConceptDraw DIAGRAM diagramming and vector drawing software extended with Rapid UML Solution from the Software Development Area is a powerful UML diagram tool.IDEF0 Diagram
The vector stencils library IDEF0 Diagram from the solution IDEF0 Diagrams contains specific IDEF0 diagram symbols such as arrow symbols and entity symbols for ConceptDraw DIAGRAM diagramming and vector drawing software. The IDEF0 Diagram solution is contained in the Software Development area of ConceptDraw Solution Park.DFD Flowchart Symbols
A Data Flow Diagram (DFD) is a graphical technique which allows effectively model and analyze the information processes and systems. The ability to fast and easy create the DFDs is made possible with Data Flow Diagrams solution from the Software Development area of ConceptDraw Solution Park. For designing the Data Flow Diagrams are used simple DFD flowchart symbols which are connected each other by arrows depicting the data flow from one step to another.Data Modeling Diagram
The vector stencils library Activity diagrams from the solution Rapid UML contains specific data modeling symbols for ConceptDraw DIAGRAM diagramming and vector drawing software. The Rapid UML solution is contained in the Software Development area of ConceptDraw Solution Park.
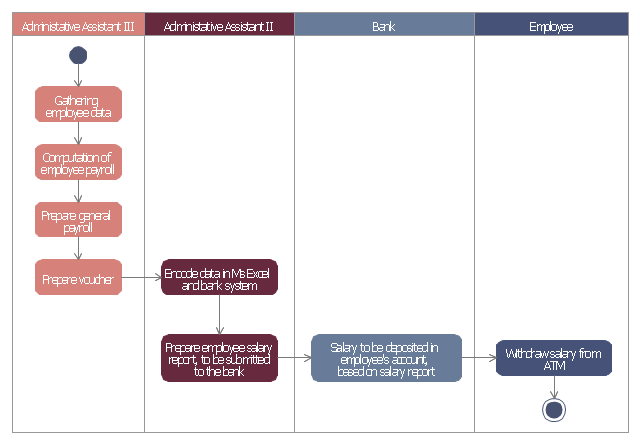
This example of automated payroll management system UML activity diagram was created on the base of figure on the webpage "Automated payroll management system" from ethelmandane.wikispaces.com.
"In the Philippines and in other foreign countries the government has a trend to embrace automation for process efficiency. One of the processes that are being automated is the payroll process. Payroll is the total amount required to pay workers and employees during a week, month or other period.
One of the government offices that desires to automate their payroll system is the NSO Camarines Sur which is located 2nd Floor MMCN Building, Panganiban Avenue, Naga City. The National Statistics Office (NSO) envisions to be recognized as a world-class provider of statistical and civil registration products and services and lives with its mission to produces and provides quality statistical and civil registration products and services. ...
The project seeks to create an Information System Plan for an Automated Payroll Management System. ...
The creation of the Information System Plan will benefit the accounting section of the organization. Specifically it is significant to:
1. Administrative Assistants. It will help to lessen time and effort in preparing and computing the salary of the employee.
2. NSO. It will help the organization to be more productive and efficient."
[ethelmandane.wikispaces.com/ ]
This file is licensed under a Creative Commons Attribution Share-Alike 3.0 License. [creativecommons.org/ licenses/ by-sa/ 3.0/ ]
This UML activity diagram example modeling the automated payroll management system using automated teller machine (ATM) was created using the ConceptDraw PRO diagramming and vector drawing software extended with the ATM UML Diagrams solution from the Software Development area of ConceptDraw Solution Park.
UML Component Diagram Example - Online Shopping
UML Component Diagram Online Shopping. This sample was created in ConceptDraw DIAGRAM diagramming and vector drawing software using the UML Component Diagram library of the Rapid UML Solution from the Software Development area of ConceptDraw Solution Park. This sample shows the concept of the online shopping and is used for the understanding of the online shopping processes, of the online shops working processes, for projection and creating of the online stores.Structured Systems Analysis and Design Method. SSADM with ConceptDraw DIAGRAM
Structured Systems Analysis and Design Method (abbr. SSADM) is a method developed in Great Britain and accepted in 1993 as a national standard for information systems development and analysis. SSADM is based on Data Flow Diagrams and is characterized with presence of clear sequence of steps at projecting, analysis, and documenting of information system. It involves 6 main stages: analysis of existing system or estimation of practicability, requirements definition, determination of technical requirements and equipment cost, development of logical data model, projecting of logical requirements and specification them, physical projecting. Each of them is also divided into several steps defining the tasks that should be fulfilled at a given stage. The most important SSADM elements are flows modeling with help of DFD, data logic modeling with help of LDS (Logical Data Structure) and description of entities behavior. Applying of SSADM is easy with ConceptDraw DIAGRAM diagramming and vector drawing software and Data Flow Diagram solution.- Interaction Overview Diagram | Data Flow Diagram Model | Data ...
- Data Flow Diagrams ( DFD ) | Dfd 0 1 2 Level For Atm
- Requirements Of A Level 1 And Level 2 For Atm Dfd
- AWS Architecture Diagrams | Level 1 Data Flow Diagram For Atm ...
- Data Flow Diagram Level 0 1 2 Examples Bank System
- Data Flow Diagram For Atm Transaction
- Dfd Of Atm Transaction System
- Data Flow Diagram Of An Atm To Check Balance
- Atm Context Diagram
- Data Flow Diagram Level 0 1 2 For Transport Management System
- Data Flow Diagrams ( DFD ) | Atm Management System Dfd
- Example of DFD for Online Store ( Data Flow Diagram ) DFD ...
- Data Flow Diagram Level 0 1 2 Example On Banks
- Data Flow Diagrams ( DFD ) | Dfd Level 1 For Library Management ...
- IDEF0 Diagrams | Level 0 Dfd Diagram For Online Shopping
- Data Flow Diagrams ( DFD ) | Interaction Overview Diagram | Bank ...
- Data Flow Diagram For Online Shopping System Level 0 1 2
- Fishbone Diagrams | Level 0 Diagram Of Online Shopping ...
- UML Deployment Diagram Example - ATM System UML diagrams ...
- Data Flow Diagrams ( DFD ) | Business Process Diagrams | Fishbone ...