Scatter Graph Charting Software

Scatter Chart Examples

Use it to draw scatter graphs using ConceptDraw PRO diagramming and vector drawing software for illustrating your documents, presentations and websites.
 Scatter Diagrams
The Scatter Diagrams solution extends ConceptDraw PRO v10 functionality with templates, samples, and a library of vector stencils that make construction of a Scatter Plot easy. The Scatter Chart Solution makes it easy to design attractive Scatter Diagrams used in various fields of science, work, and life activities. ConceptDraw PRO lets you enter the data to the table and construct the Scatter Plot Graph automatically according to these data.
HelpDesk
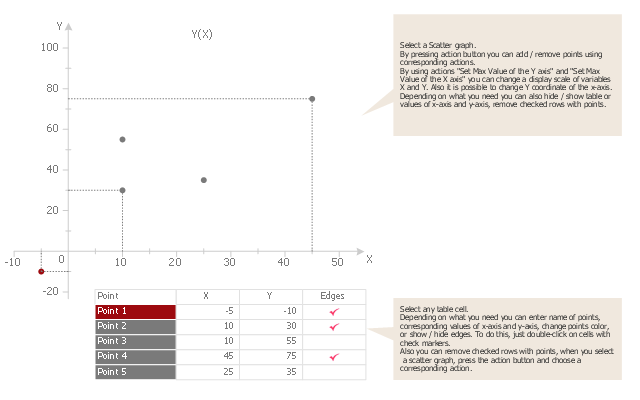
How to Draw a Scatter Diagram Using ConceptDraw PRO

Scatter Graph

How to Create a Scatter Chart

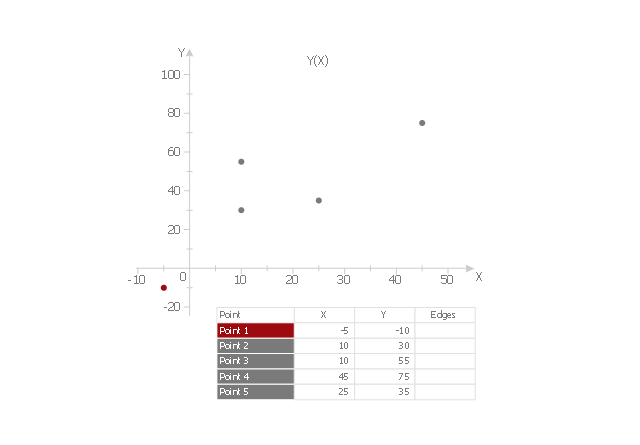
Blank Scatter Plot

Use this template to design your scatter charts.
"A scatter plot, scatterplot, or scattergraph is a type of mathematical diagram using Cartesian coordinates to display values for two variables for a set of data.
The data is displayed as a collection of points, each having the value of one variable determining the position on the horizontal axis and the value of the other variable determining the position on the vertical axis. This kind of plot is also called a scatter chart, scattergram, scatter diagram, or scatter graph." [Scatter plot. Wikipedia]
The template "Scatter graph" for the ConceptDraw PRO diagramming and vector drawing software is included in the Scatter Diagrams solution from the Graphs and Charts area of ConceptDraw Solution Park.
Template
Make a Scatter Plot

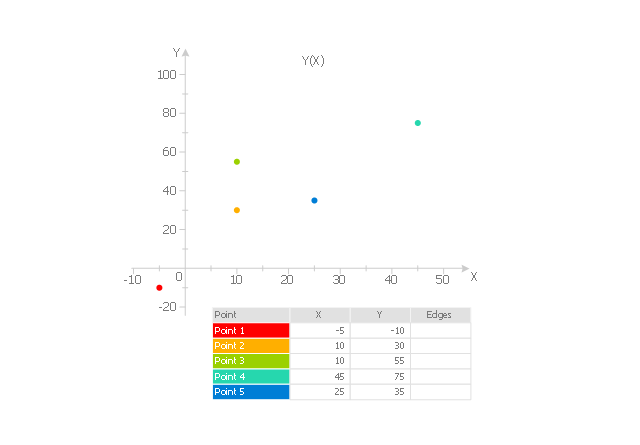
Scatter Plot

 Basic Scatter Diagrams
This solution extends ConceptDraw PRO v10.3.0 (or later) with templates, samples and a library of vector stencils for drawing Scatter Diagrams.
Scatter Diagram

Using the ready-to-use objects from the Line Graphs Solution for ConceptDraw PRO you can create your own professional looking Scatter Charts quick and easy.
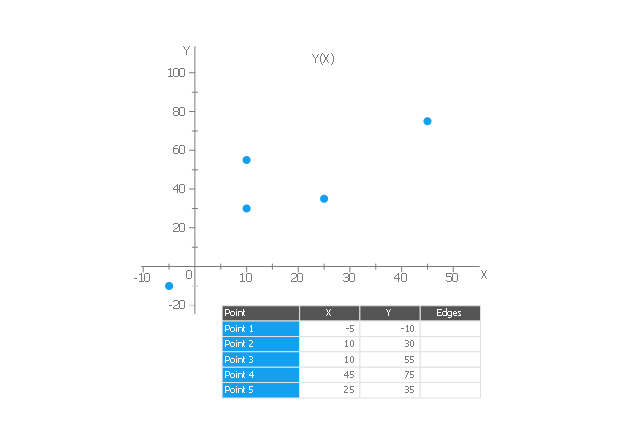
Scatter Chart

The vector stencils library "Scatter graphs" contains 7 templates of scatter diagrams (scattergraphs, scatter charts, scatter plots, scatterplots, scatter diagrams) for visual analysis of correlation between two variables.
Use these shapes to draw your scatterplots in the ConceptDraw PRO diagramming and vector drawing software.
The vector stencils library "Scatter graphs" is included in the Scatter Diagrams solution of the Graphs and Charts area in ConceptDraw Solution Park.
Use these shapes to draw your scatterplots in the ConceptDraw PRO diagramming and vector drawing software.
The vector stencils library "Scatter graphs" is included in the Scatter Diagrams solution of the Graphs and Charts area in ConceptDraw Solution Park.
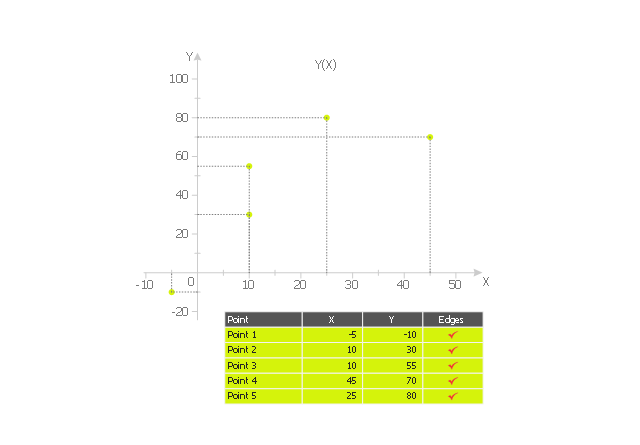
Scatter graph 1
Scatter graph 2
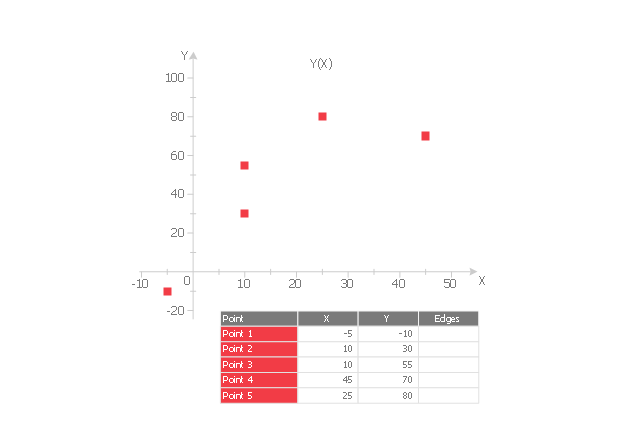
Scatter graph 3
Scatter graph 4
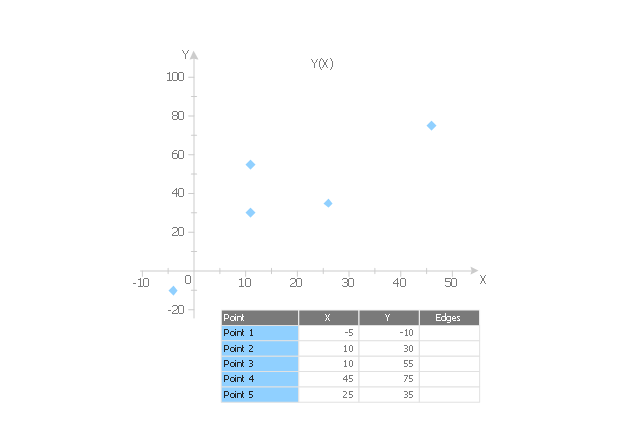
Scatter graph 5
Scatter graph 6
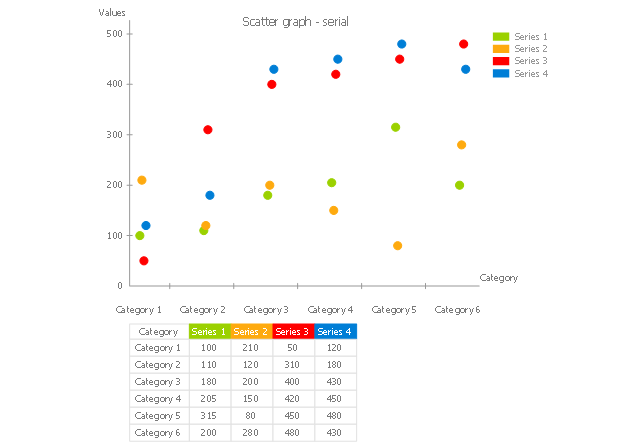
Scatter graph - serial
Scatter Chart Analysis. Scatter Chart Example

- Scatter Diagrams | Seven Basic Tools of Quality - Quality Control ...
- Scatter Chart Examples | Scatter Graph | Scatter Diagrams ...
- Scatter Diagrams | Blank Scatter Plot | How to Draw a Scatter ...
- How to Draw a Scatter Diagram Using ConceptDraw PRO | Scatter ...
- Blank Scatter Plot | Scatter Graph Charting Software | Create a ...
- Scatter Diagrams | Basic Scatter Diagrams | Seven Basic Tools of ...
- Baby Age And Height Scatter Plot
- Example Of A Scatter Graph
- Scatter Chart Examples | Scatter graph - Template | Scatter graphs ...
- Scatter Diagrams | Scatter Chart Examples | Scatter Graph Charting ...
- Target market - Onion diagram | Competitor Analysis | Scatter ...
- Scatter Diagrams | Scatter Graph | Scatter Graph Charting Software ...
- Scatter Chart Examples | Scatter Diagrams | How to Draw a Scatter ...
- Scatter Diagrams | Scatter Chart Examples | Blank Scatter Plot ...
- Scatter Graph | Make a Scatter Plot | Blank Scatter Plot | Scatter Plot
- Scatter Chart Examples | Scatter Graph | Blank Scatter Plot ...
- Scatter Graph Charting Software | Scatter Plot Graph | Scatter Chart ...
- Scatter Graph Charting Software | Scatter Chart | How to Create a ...
- Blank Scatter Plot | Scatter Chart Examples | Four Dimensions ...
- Baby height by age | Scatter Diagrams | Fully Connected Network ...
- ERD | Entity Relationship Diagrams, ERD Software for Mac and Win
- Flowchart | Basic Flowchart Symbols and Meaning
- Flowchart | Flowchart Design - Symbols, Shapes, Stencils and Icons
- Flowchart | Flow Chart Symbols
- Electrical | Electrical Drawing - Wiring and Circuits Schematics
- Flowchart | Common Flowchart Symbols
- Flowchart | Common Flowchart Symbols