Seven Basic Tools of Quality - Flow Chart
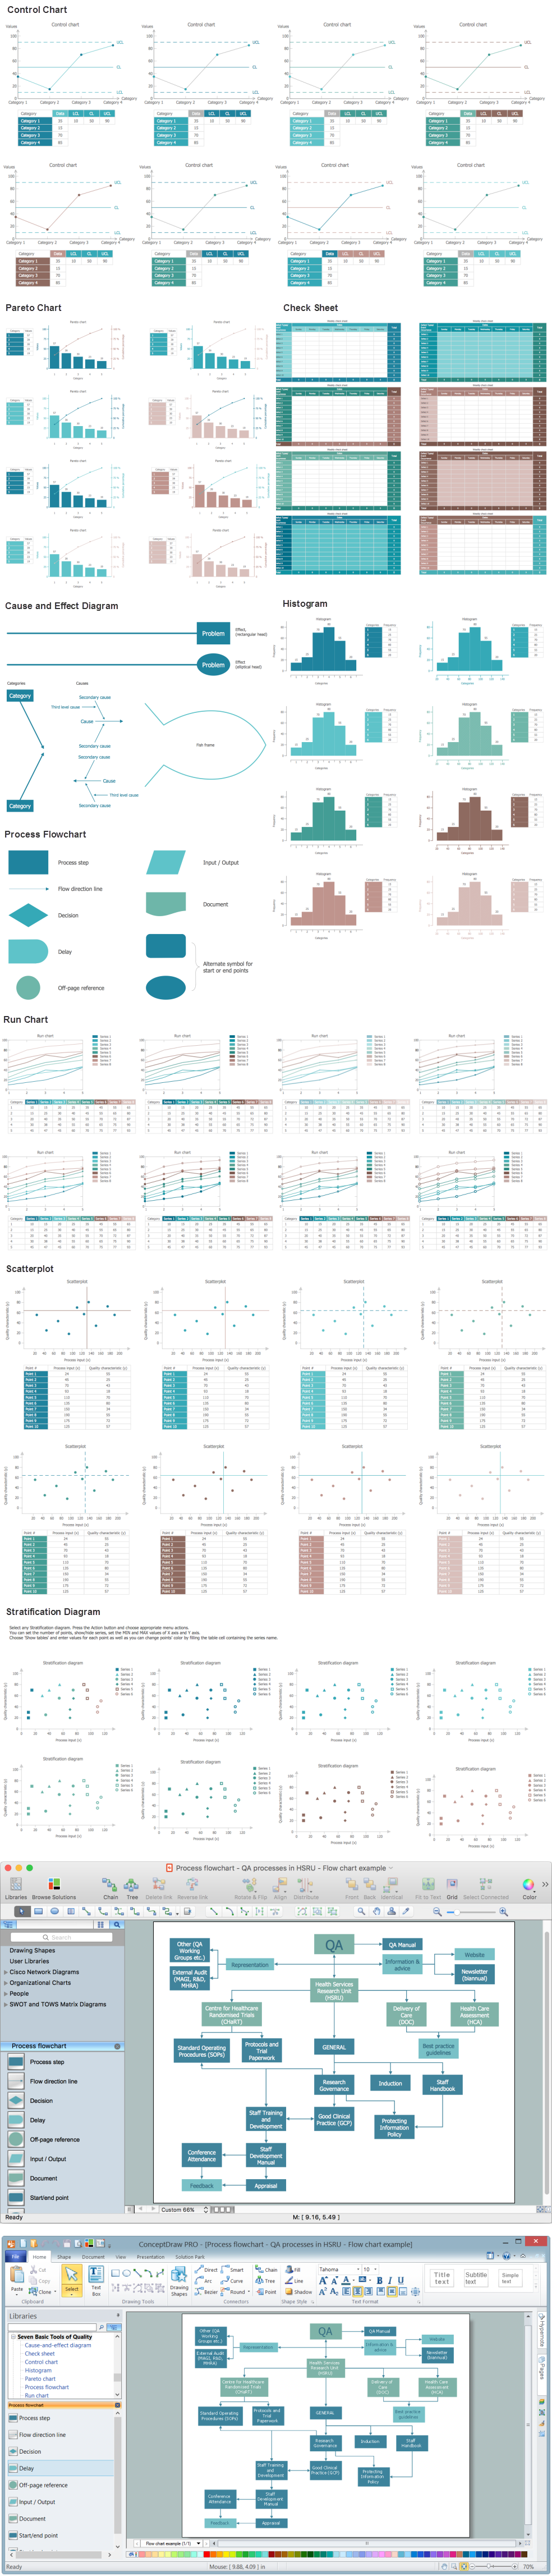
Seven Basic Tools of Quality — Quality Control

Swim Lane Diagrams

 Scatter Diagrams
The Scatter Diagrams solution extends ConceptDraw DIAGRAM functionality with templates, samples, and a library of vector stencils that make construction of a Scatter Plot easy. The Scatter Chart Solution makes it easy to design attractive Scatter Diagrams used in various fields of science, work, and life activities. ConceptDraw DIAGRAM lets you enter the data to the table and construct the Scatter Plot Graph automatically according to these data.
Seven Basic Tools of Quality - Pareto Chart
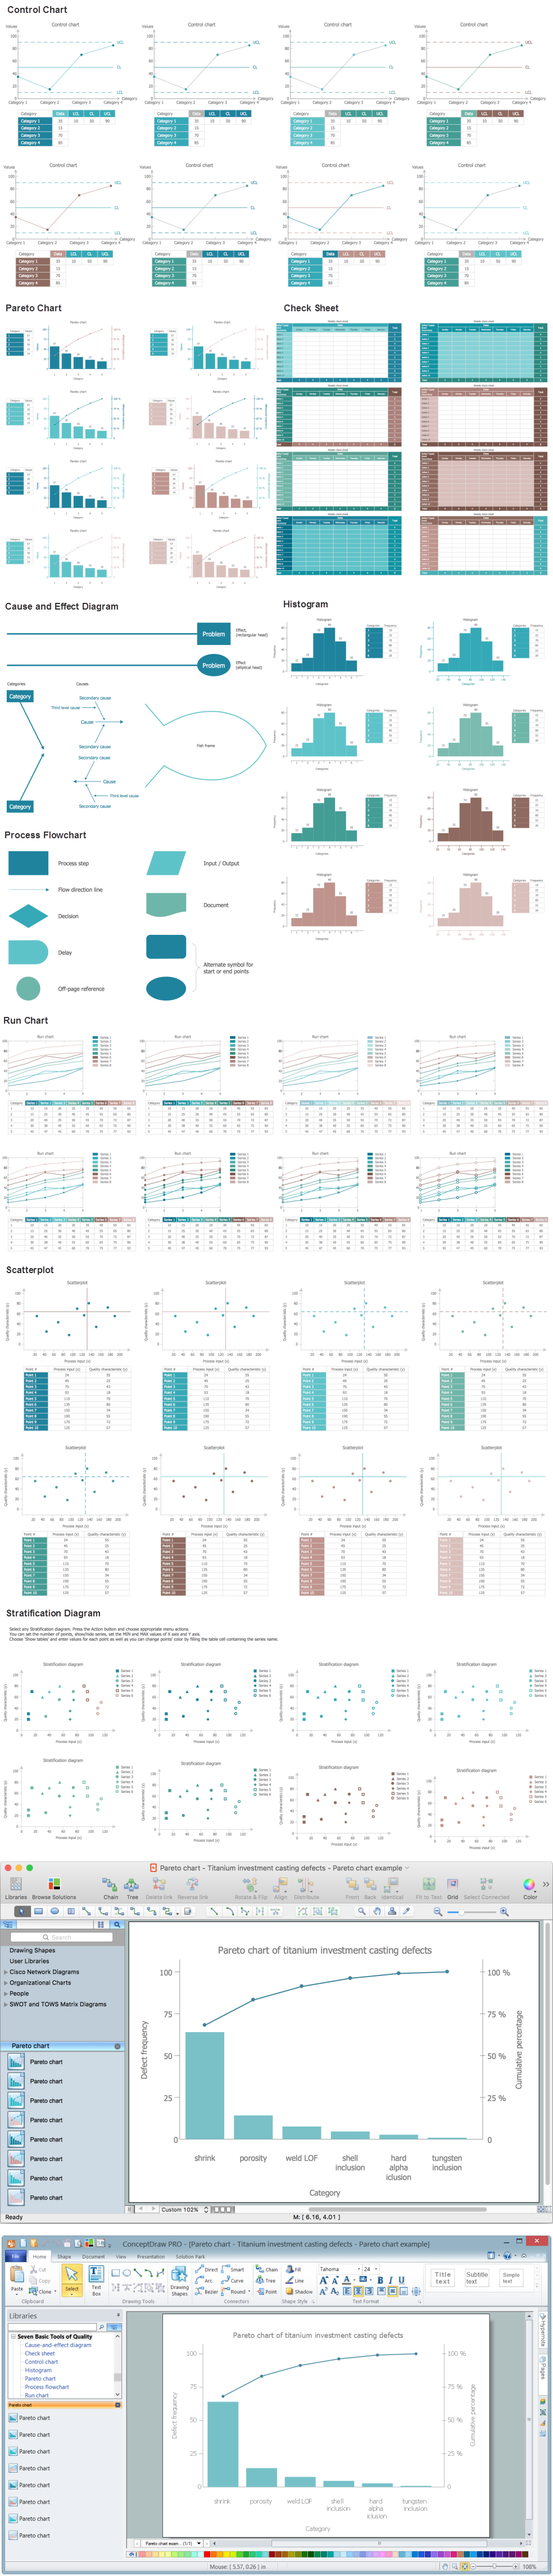
 Seven Basic Tools of Quality
Manage quality control in the workplace, using fishbone diagrams, flowcharts, Pareto charts and histograms, provided by the Seven Basic Tools of Quality solution.
Seven Basic Tools of Quality - Histogram

 Basic Scatter Diagrams
This solution extends ConceptDraw DIAGRAM (or later) with templates, samples and a library of vector stencils for drawing Scatter Diagrams.
 Education Package
Education Package is a comprehensive set of multifarious graphical solutions from ConceptDraw Solution Park, collected together in help to ConceptDraw DIAGRAM users working in a field of science, education and training, which is aimed at improving the quality of education and helping to design with ease variety of interesting and colorful educational materials, diagrams, charts and maps. Use it to present the information and knowledge in an interesting, clear, structured and simple form to achieve a success in education and pedagogy, to maintain the interest of students and pupils throughout the whole learning process, at the lectures, lessons and even during independent work with additional materials, to contribute to better perception of scientific information by listeners during the conferences and reports.
 Correlation Dashboard
Correlation dashboard solution extends ConceptDraw DIAGRAM software with samples, templates and vector stencils library with Scatter Plot Charts for drawing the visual dashboard visualizing data correlation.
Business Package for Management
Package intended for professional who designing and documenting business processes, preparing business reports, plan projects and manage projects, manage organizational changes, prepare operational instructions, supervising specific department of an organization, workout customer service processes and prepare trainings for customer service personal, carry out a variety of duties to organize business workflow.
- Total Quality Management TQM Diagrams | Blank Scatter Plot ...
- Scatter Diagram In Tqm
- Scatter Chart Examples | Scatter Diagrams | How to Draw a Scatter ...
- Scatter Plot Diagram On Tqm With Example
- Stratification diagram example
- Scatter Diagram In Total Quality Management
- Stratification diagram example | Seven Basic Tools of Quality ...
- Total Quality Management TQM Diagrams | Visual Presentations ...
- Scatter Diagrams | Total Quality Management TQM Diagrams | Basic ...
- Pdpc In Total Quality Management Drawing Example
- Scatter Diagrams | Pyramid Diagram | Total Quality Management ...
- Bubble Plot | Blank Scatter Plot | Scatter Chart Examples | Diagram ...
- Scatter Diagrams | Blank Scatter Plot | Scatter Chart Examples ...
- Seven Basic Tools of Quality - Fishbone Diagram | Probability ...
- Stratification Diagram In Tqm
- Scatter Chart Examples | Scatter Graph | Blank Scatter Plot ...
- Scatter Chart Examples | Four Dimensions Bubble Plot | Blank ...
- Examples Of Relation Diagram Of Tqm
- Scatter Chart Examples | Blank Scatter Plot | The Best Drawing ...