Seven Basic Tools of Quality - Flow Chart
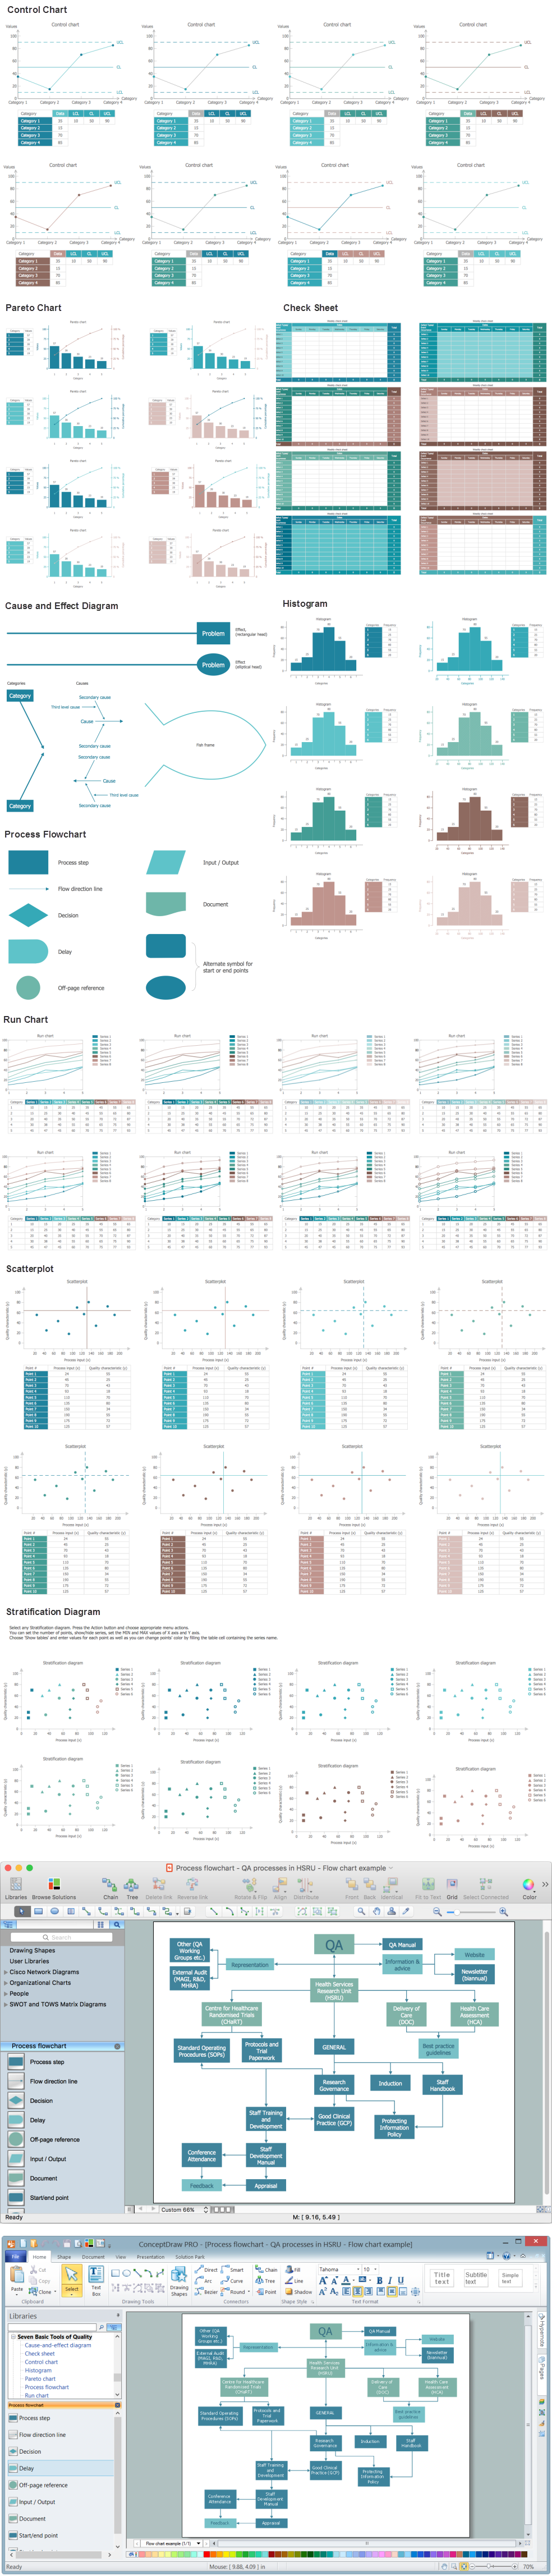
Seven Basic Tools of Quality — Quality Control

 Scatter Diagrams
The Scatter Diagrams solution extends ConceptDraw DIAGRAM functionality with templates, samples, and a library of vector stencils that make construction of a Scatter Plot easy. The Scatter Chart Solution makes it easy to design attractive Scatter Diagrams used in various fields of science, work, and life activities. ConceptDraw DIAGRAM lets you enter the data to the table and construct the Scatter Plot Graph automatically according to these data.
Seven Basic Tools of Quality - Fishbone Diagram

Seven Basic Tools of Quality - Pareto Chart
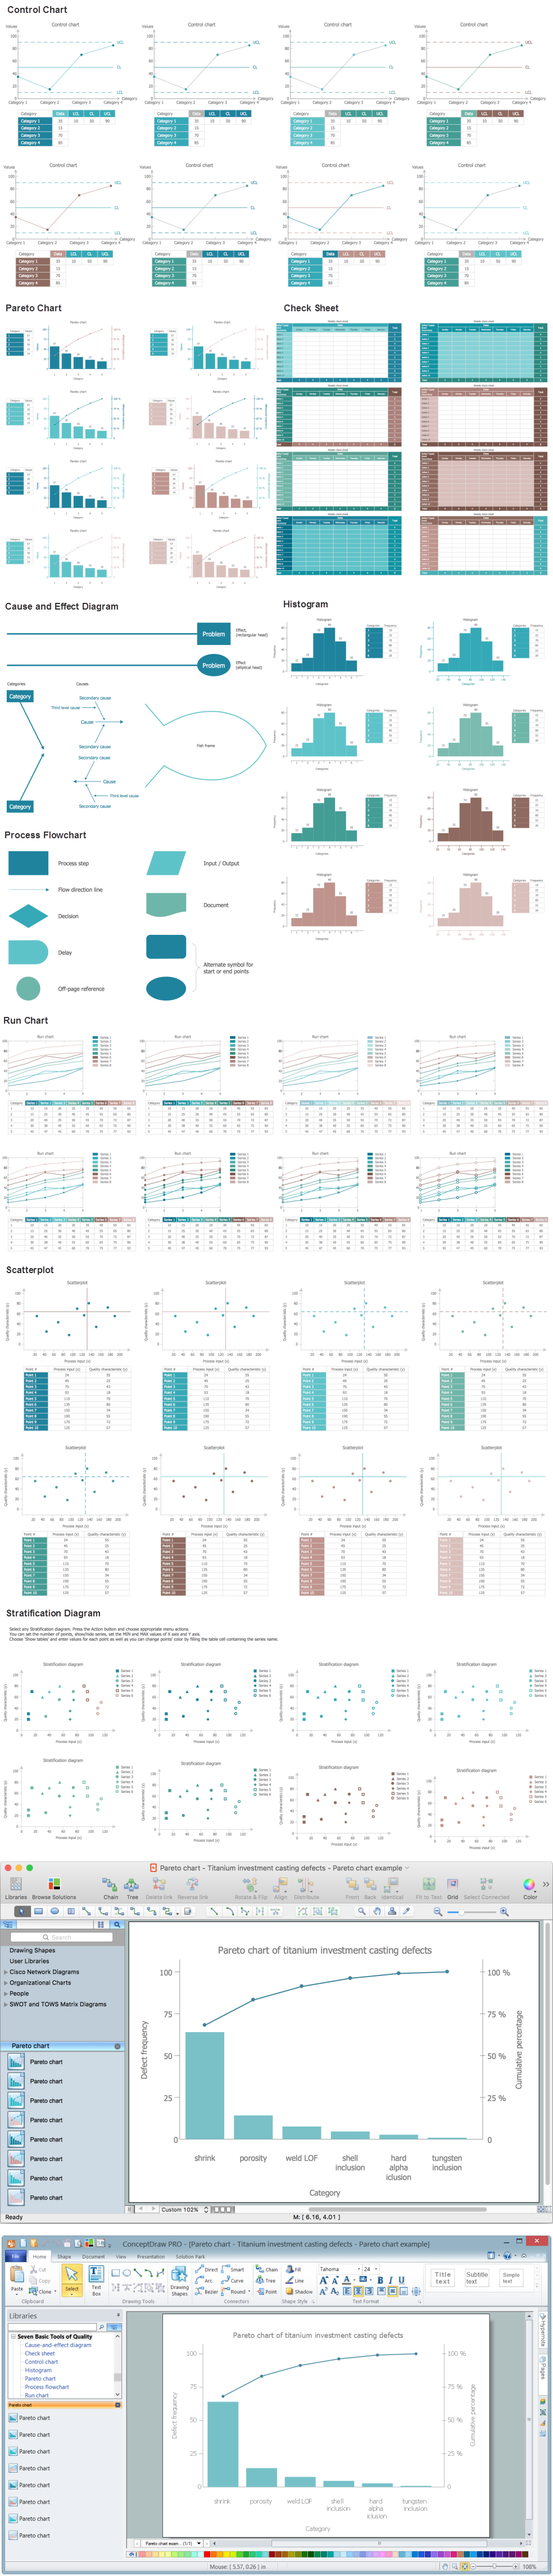
Bar Diagrams for Problem Solving. Create business management bar charts with Bar Graphs Solution

Visual Presentations Made Easy with Diagramming Software


 Basic Scatter Diagrams
This solution extends ConceptDraw DIAGRAM (or later) with templates, samples and a library of vector stencils for drawing Scatter Diagrams.
 Seven Basic Tools of Quality
Manage quality control in the workplace, using fishbone diagrams, flowcharts, Pareto charts and histograms, provided by the Seven Basic Tools of Quality solution.
Sales Growth. Bar Graphs Example

Basic Circles Venn Diagram. Venn Diagram Example

Swim Lane Diagrams

Venn Diagram Examples for Problem Solving. Environmental Social Science. Human Sustainability Confluence

Total Quality Management Value

 Total Quality Management TQM Diagrams
Total Quality Management Diagrams solution extends ConceptDraw DIAGRAM software with samples, templates and vector stencils library for drawing the TQM flowcharts.
- Scatterplot Diagram On Tqm With Example
- Total Quality Management TQM Diagrams | Blank Scatter Plot ...
- Scatter Diagram In Tqm
- Scatter Diagram In Total Quality Management
- Scatter Chart Examples | Scatter Diagrams | How to Draw a Scatter ...
- Scatter Diagrams | Seven Basic Tools of Quality - Quality Control ...
- Stratification diagram example | Seven Basic Tools of Quality ...
- Scatter Diagrams | Total Quality Management TQM Diagrams | Basic ...
- Bubble Plot | Blank Scatter Plot | Scatter Chart Examples | Diagram ...
- Scatter Diagrams | Pyramid Diagram | Total Quality Management ...
- Scatter Diagram Tqm
- Blank Scatter Plot | Probability Quality Control Tools | Workflow ...
- Scatter Diagrams | Scatter Graph | Scatter Chart Examples | Scatter ...
- Scatter Chart Examples | Four Dimensions Bubble Plot | Blank ...
- Stratification Diagram In Tqm
- Seven Basic Tools of Quality - Fishbone Diagram | Probability ...
- Scatter Chart Examples | Blank Scatter Plot | The Best Drawing ...
- Stratification diagram example | Seven Basic Tools of Quality ...
- Scatter Graph | Make a Scatter Plot | Blank Scatter Plot | Scatter Plot