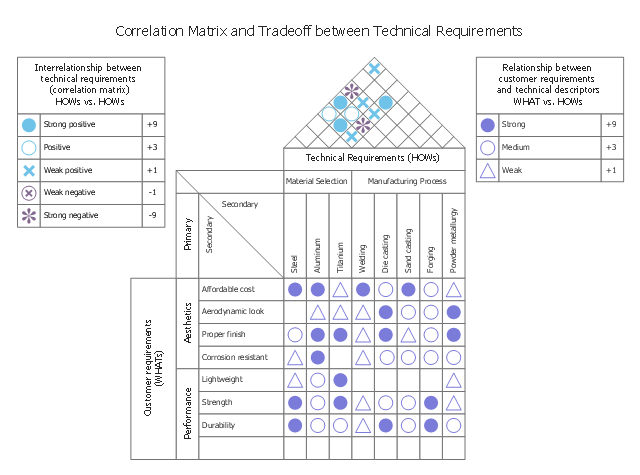
This house of quality sample illustrates correlation matrix.
It was designed on the base of the figure 3-5 in Lecture "How QFD helps in product quality improvement?" from the website of National Programme on Technology Enhanced Learning (NPTEL), India. [nptel.ac.in/ courses/ 110101010/ downloads/ mod3/ Module%20 III-Lec1.pdf]
Distributed under Creative Commons Attribution-ShareAlike 4.0 International (CC BY-SA 4.0) [creativecommons.org/ licenses/ by-sa/ 4.0/ ]
"After drafting the relationship matrix, it is evaluated for any empty row or column. An empty row indicates that a customer voice is not being addressed by any technical descriptors. Thus, the customer expectation is not being met. Any blank column indicates that the technical requirement is unnecessary, as it does not address any VOC.
The roof of the house of quality, expressed as correlation matrix, is used to identify any interrelationships between the technical descriptors (Figure 3-5). Symbols are used to describe the strength of the interrelationships. Symbols generally preferred are:
- A ‘solid circle’ represents a strong positive relationship.
- A ‘circle’ represents a positive relationship.
- An ‘X’ represents a negative relationship.
- An ‘asterisk’ represents a strong negative relationship." [nptel.ac.in/ courses/ 110101010/ modules/ module3/ lec1/ 1.7.html]
The HOQ example "House of Quality - correlation matrix" was designed using ConceptDraw PRO software extended with House of Quality solution from Quality area of ConceptDraw PRO Solution Park.
HOQ of a handlebar stem in a bicycle
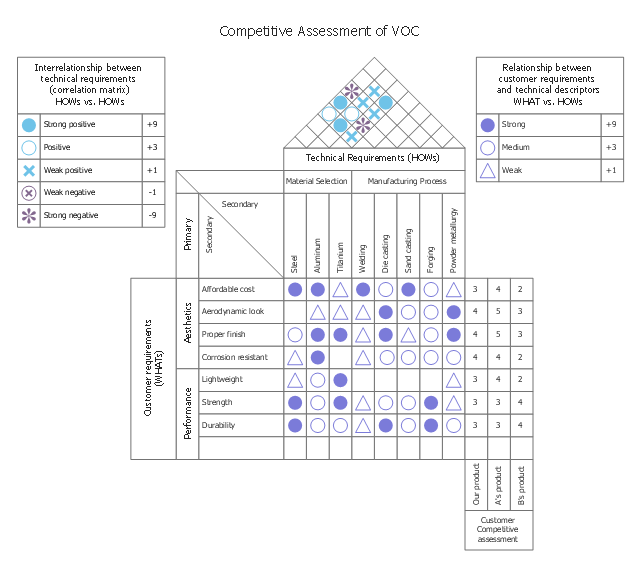
This house of quality sample illustrates competative assessment of voice of the customer (VOC).
It was designed on the base of the figure 3-6 in Lecture "How QFD helps in product quality improvement?" from the website of National Programme on Technology Enhanced
Learning (NPTEL), India. [nptel.ac.in/ courses/ 110101010/ downloads/ mod3/ Module%20 III-Lec1.pdf]
Distributed under Creative Commons Attribution-ShareAlike 4.0 International (CC BY-SA 4.0) [creativecommons.org/ licenses/ by-sa/ 4.0/ ]
"The customer’s competitive assessment (Figure 3-6) is a pair of table (or graph) that depicts how competitive products compare with current organization product status on specific VOC. The customer competitive assessment is the block of columns corresponding to each customer requirement in the house of quality on the right side of the relationship matrix, The numbers 1 through 5 are listed in the competitive evaluation column to indicate a rating of 1 for worst and 5 for best. The customer competitive assessment is a good way to determine if the customer voice has been met (as compared to best competitor) and identify areas to improvement for future design." [nptel.ac.in/ courses/ 110101010/ modules/ module3/ lec1/ 1.8.html]
The HOQ example "House of Quality - customer’s competitive assessment" was designed using ConceptDraw PRO software extended with House of Quality solution from Quality area of ConceptDraw PRO Solution Park.
HOQ of a handlebar stem in a bicycle
 House of Quality
House of Quality solution provides the powerful drawing tools, numerous specific samples and examples, and set of vector design elements of House of Quality shapes and symbols, which will help you in application the Quality function deployment (QFD) methodology and in easy creation the House of Quality Matrices intended for satisfaction the consumers' desires and requirements, for representing them in a visual way and then transformation into the targets and technical requirements to be followed for development the best products.
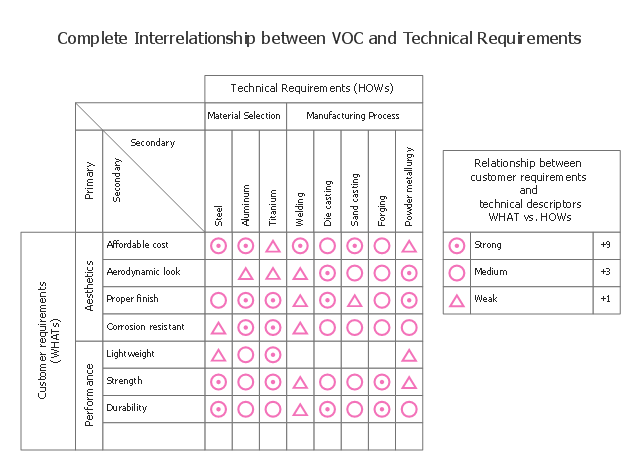
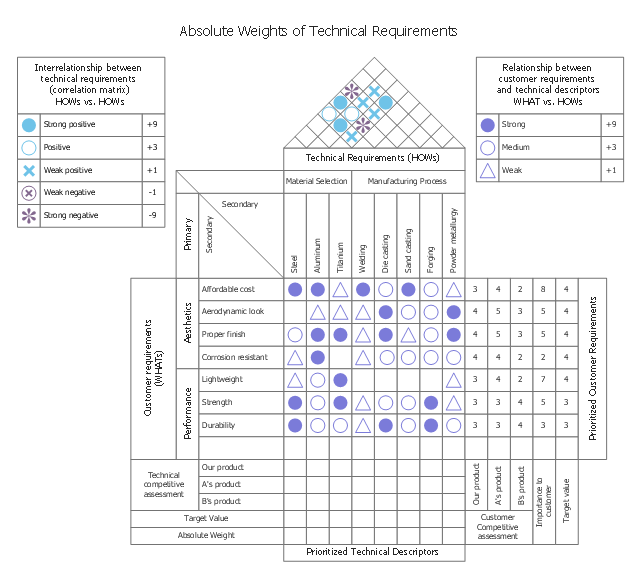
This house of quality sample illustrates interrelationship matrix.
It was designed on the base of the figure 3-4 in Lecture "How QFD helps in product quality improvement?" from the website of National Programme on Technology Enhanced
Learning (NPTEL), India. [nptel.ac.in/ courses/ 110101010/ downloads/ mod3/ Module%20 III-Lec1.pdf]
Distributed under Creative Commons Attribution-ShareAlike 4.0 International (CC BY-SA 4.0) [creativecommons.org/ licenses/ by-sa/ 4.0/ ]
"The next step in building a house of quality is to compare the VOC with technical characteristics and determine their interrelationships. In this context, engineering knowledge about the product and historic evidence/ data can provide useful information. Common practice is to use symbols to represent the nature of relationship between customer requirements and technical descriptors. Symbols used are:
- A solid circle represents a strong relationship (scored as +9).
- A single circle represents a medium relationship. (scored as +3).
- A triangle represents a weak relationship (scored as +1).
- The box is left blank if there is no relationship between VOC and technical characteristics.
Figure 3-4 provides the interrelationship matrix with type of relationships. Any cell that is empty implies no or insignificant relationship." [nptel.ac.in/ courses/ 110101010/ modules/ module3/ lec1/ 1.6.html]
The HOQ example "House of Quality - interrelationship matrix" was designed using ConceptDraw PRO software extended with House of Quality solution from Quality area of ConceptDraw PRO Solution Park.
HOQ of a handlebar stem in a bicycle
PROBLEM ANALYSIS. Relations Diagram

ConceptDraw OFFICE suite is a software for relation diagram making.

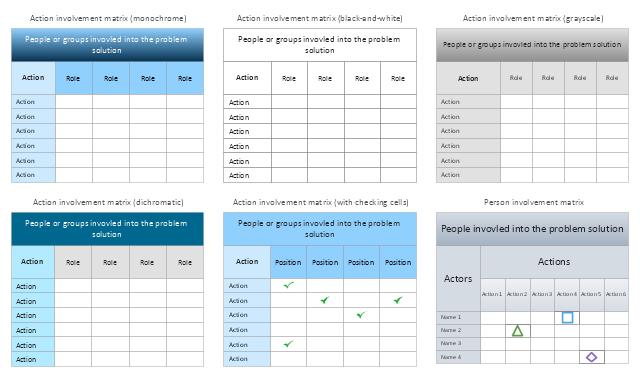
The vector stencils library Involvement matrix contains 20 templates and symbols for drawing the involvement matrices using the ConceptDraw PRO diagramming and vector drawing software. The involvement matrix is one of the Seven Management and Planning Tools (7 MP tools, Seven New Quality Tools).
"Matrix Diagram ... shows the relationship between items. At each intersection a relationship is either absent or present. It then gives information about the relationship, such as its strength, the roles played by various individuals or measurements. Six differently shaped matrices are possible: L, T, Y, X, C, R and roof-shaped, depending on how many groups must be compared." [Seven Management and Planning Tools. Wikipedia]
Use it to show what people and groups are involved in actions, and what their role is in every action.
The example "Design elements - Involvement matrix" is included in the solution "Seven Management and Planning Tools" from the Management area of ConceptDraw Solution Park.
Involvement matrices
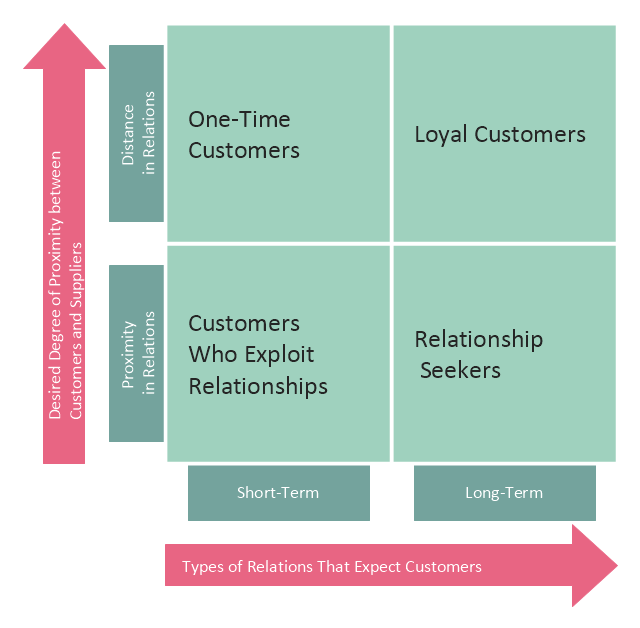
This customer types matrix diagram distribute customers into four categories depending of two criteria: 1) desired degree of proximity between customers and suppliers, and 2) types of relations that expect customers.
One time customers have short-term relations with suppliers and characterized by distance in relations with them.
Loyal customers have long-term relations with suppliers and characterized by distance in relations with them.
Customers who exploit relationships have short-term relations with suppliers and characterized by proximity in relations with them.
Relationship seekers have long-term relations with suppliers and characterized by proximity in relations with them.
This customer types matrix diagram example was created using the ConceptDraw PRO diagramming and vector drawing software extended with the Matrices solution from the Marketing area of ConceptDraw Solution Park.
Customer types diagram
Relationships Analysis

The Seven Management and Planning Tools is a tool for Interaction diagram drawing. This diagram identifies causal relationships. Determine what factors are causes and which factors are effects. Interaction diagram helps establish KPIs to monitor changes and the effectiveness of corrective actions in resolving the problem.
This house of quality sample illustrates prioritized technical descriptors.
It was designed on the base of the figure 3-7 in Lecture "How QFD helps in product quality improvement?" from the website of National Programme on Technology Enhanced
Learning (NPTEL), India. [nptel.ac.in/ courses/ 110101010/ downloads/ mod3/ Module%20 III-Lec1.pdf]
Distributed under Creative Commons Attribution-ShareAlike 4.0 International (CC BY-SA 4.0) [creativecommons.org/ licenses/ by-sa/ 4.0/ ]
"The technical competitive assessment makes up a block of rows corresponding to each technical descriptor in the house of quality beneath the relationship matrix. After respective technical factors have been established, the products are evaluated for each technical factor that addresses VOC.
Similar to the customer competitive assessment, the data recorded are in a scale of 1 through 5, to indicate a rating, 1 for worst and 5 for best. The technical competitive assessment is often useful in uncovering gaps in engineering judgment.
Importance ratings represent the relative importance of customer requirement in terms of each other.
The target-value of column can be on the same scale as the customer competitive assessment (1 for worst, 5 for best can be used). This column is where the QFD team decides whether they want to keep their product unchanged, improve the product, or make the product better than the competitor.
The prioritized technical descriptors make up a block of rows corresponding to the technical descriptor in the house of quality below the technical competitive assessment as shown in Figure 3-7. These prioritized technical descriptors contain target value and absolute weights." [nptel.ac.in/ courses/ 110101010/ modules/ module3/ lec1/ 1.9.html]
The HOQ example "House of Quality - prioritized technical descriptors" was designed using ConceptDraw PRO software extended with House of Quality solution from Quality area of ConceptDraw PRO Solution Park.
HOQ of a handlebar stem in a bicycle
 Entity-Relationship Diagram (ERD)
An Entity-Relationship Diagram (ERD) is a visual presentation of entities and relationships. That type of diagrams is often used in the semi-structured or unstructured data in databases and information systems. At first glance ERD is similar to a flowch
Software for Creating SWOT Analysis Diagrams

Product Planning

HelpDesk
How to Draw a Matrix Organizational Chart

This house of quality matrix sample was designed on the base of the Wikimedia Commons file: Het kwaliteitshuis.png.
[commons.wikimedia.org/ wiki/ File:Het_ kwaliteitshuis.png]
This file is licensed under the Creative Commons Attribution-Share Alike 3.0 Unported license. [creativecommons.org/ licenses/ by-sa/ 3.0/ deed.en]
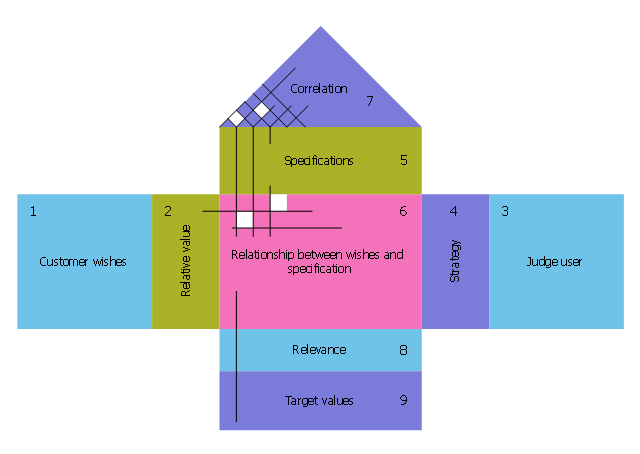
"The House of Quality is an assembly of several deployment hierarchies and tables, including the Demanded Quality Hierarchy, Quality Characteristics Hierarchy, the relationships matrix, the Quality Planning Table, and Design Planning Table. It is a table that connects dots between the Voice of the Customer and the Voice of the Engineer." ["Frequently Asked Questions about QFD". QFDI.org. QFD Institute. web.archive.org/ web/ 20131213044623/ https:/ / www.qfdi.org/ what_ is_ qfd/ faqs_ about_ qfd.htm#What%20 is%20 the%20 House%20 of%20 Quality%20 Why%20 it%20 isnt%20 a%20 QFD]
The HOQ example "QFD house of quality" was designed using ConceptDraw PRO software extended with House of Quality solution from Quality area of ConceptDraw PRO Solution Park.
[commons.wikimedia.org/ wiki/ File:Het_ kwaliteitshuis.png]
This file is licensed under the Creative Commons Attribution-Share Alike 3.0 Unported license. [creativecommons.org/ licenses/ by-sa/ 3.0/ deed.en]
"The House of Quality is an assembly of several deployment hierarchies and tables, including the Demanded Quality Hierarchy, Quality Characteristics Hierarchy, the relationships matrix, the Quality Planning Table, and Design Planning Table. It is a table that connects dots between the Voice of the Customer and the Voice of the Engineer." ["Frequently Asked Questions about QFD". QFDI.org. QFD Institute. web.archive.org/ web/ 20131213044623/ https:/ / www.qfdi.org/ what_ is_ qfd/ faqs_ about_ qfd.htm#What%20 is%20 the%20 House%20 of%20 Quality%20 Why%20 it%20 isnt%20 a%20 QFD]
The HOQ example "QFD house of quality" was designed using ConceptDraw PRO software extended with House of Quality solution from Quality area of ConceptDraw PRO Solution Park.
HOQ matrix
Six Markets Model Chart Template

CCTV Network Diagram Software

Matrix Organization Structure

Now we have ConceptDraw DIAGRAM diagramming and vector drawing software extended with 25 Typical Orgcharts solution from the Management area of ConceptDraw Solution Park which will help easy represent matrix organizational structure of any degree of complexity.
Probability Quality Control Tools

 Matrices
This solution extends ConceptDraw DIAGRAM software with samples, templates and library of design elements for drawing the business matrix diagrams.
- Customer Relationship Matrix
- Customer types matrix | PROBLEM ANALYSIS. Relations Diagram ...
- Relationship Matrix Template Excel
- Relationship Matrix Example
- Relationship Matrix Template
- Customer types matrix | Eisenhower box | Matrices | Relationship ...
- Entity- Relationship Diagram (ERD) | How to Help Customers be ...
- House of Quality - interrelationship matrix | PROBLEM ANALYSIS ...
- House of Quality | House of Quality Matrix Software | How to Create ...
- Design elements - HOQ symbols | HOQ | HOQ matrix - Template | Hoq
- Puzzle piece diagram - Alternating sign matrix | The relationship ...
- Sales department - Vector stencils library | Customer types matrix ...
- Process Flowchart | Matrix Organization Structure | Basic Flowchart ...
- Matrices | Competitor Analysis | BCG Matrix | Types Of Matrix In ...
- Process Flowchart | Competitor Analysis | SWOT Matrix Template ...
- Entity- Relationship Diagram (ERD) | Fishbone Diagram | SWOT and ...
- How To Create the Interaction ( Relation ) Diagram | ConceptDraw ...
- Excel Template Responsibility Matrix
- Customer types matrix | Block diagram - Sources of customer ...
- Person involvement matrix - Template | A Responsibility Assignment ...
- ERD | Entity Relationship Diagrams, ERD Software for Mac and Win
- Flowchart | Basic Flowchart Symbols and Meaning
- Flowchart | Flowchart Design - Symbols, Shapes, Stencils and Icons
- Flowchart | Flow Chart Symbols
- Electrical | Electrical Drawing - Wiring and Circuits Schematics
- Flowchart | Common Flowchart Symbols
- Flowchart | Common Flowchart Symbols