This house of quality sample illustrates interrelationship matrix.
It was designed on the base of the figure 3-4 in Lecture "How QFD helps in product quality improvement?" from the website of National Programme on Technology Enhanced
Learning (NPTEL), India. [nptel.ac.in/ courses/ 110101010/ downloads/ mod3/ Module%20 III-Lec1.pdf]
Distributed under Creative Commons Attribution-ShareAlike 4.0 International (CC BY-SA 4.0) [creativecommons.org/ licenses/ by-sa/ 4.0/ ]
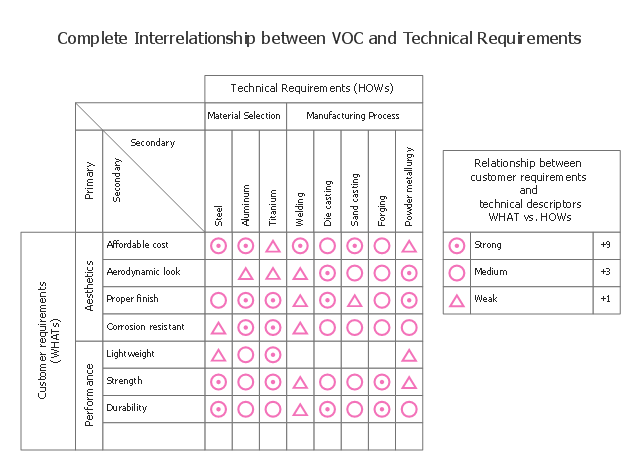
"The next step in building a house of quality is to compare the VOC with technical characteristics and determine their interrelationships. In this context, engineering knowledge about the product and historic evidence/ data can provide useful information. Common practice is to use symbols to represent the nature of relationship between customer requirements and technical descriptors. Symbols used are:
- A solid circle represents a strong relationship (scored as +9).
- A single circle represents a medium relationship. (scored as +3).
- A triangle represents a weak relationship (scored as +1).
- The box is left blank if there is no relationship between VOC and technical characteristics.
Figure 3-4 provides the interrelationship matrix with type of relationships. Any cell that is empty implies no or insignificant relationship." [nptel.ac.in/ courses/ 110101010/ modules/ module3/ lec1/ 1.6.html]
The HOQ example "House of Quality - interrelationship matrix" was designed using ConceptDraw PRO software extended with House of Quality solution from Quality area of ConceptDraw PRO Solution Park.
It was designed on the base of the figure 3-4 in Lecture "How QFD helps in product quality improvement?" from the website of National Programme on Technology Enhanced
Learning (NPTEL), India. [nptel.ac.in/ courses/ 110101010/ downloads/ mod3/ Module%20 III-Lec1.pdf]
Distributed under Creative Commons Attribution-ShareAlike 4.0 International (CC BY-SA 4.0) [creativecommons.org/ licenses/ by-sa/ 4.0/ ]
"The next step in building a house of quality is to compare the VOC with technical characteristics and determine their interrelationships. In this context, engineering knowledge about the product and historic evidence/ data can provide useful information. Common practice is to use symbols to represent the nature of relationship between customer requirements and technical descriptors. Symbols used are:
- A solid circle represents a strong relationship (scored as +9).
- A single circle represents a medium relationship. (scored as +3).
- A triangle represents a weak relationship (scored as +1).
- The box is left blank if there is no relationship between VOC and technical characteristics.
Figure 3-4 provides the interrelationship matrix with type of relationships. Any cell that is empty implies no or insignificant relationship." [nptel.ac.in/ courses/ 110101010/ modules/ module3/ lec1/ 1.6.html]
The HOQ example "House of Quality - interrelationship matrix" was designed using ConceptDraw PRO software extended with House of Quality solution from Quality area of ConceptDraw PRO Solution Park.
HOQ of a handlebar stem in a bicycle
PROBLEM ANALYSIS. Relations Diagram


 House of Quality
House of Quality solution provides the powerful drawing tools, numerous specific samples and examples, and set of vector design elements of House of Quality shapes and symbols, which will help you in application the Quality function deployment (QFD) methodology and in easy creation the House of Quality Matrices intended for satisfaction the consumers' desires and requirements, for representing them in a visual way and then transformation into the targets and technical requirements to be followed for development the best products.
Entity Relationship Software

 Entity-Relationship Diagram (ERD)
An Entity-Relationship Diagram (ERD) is a visual presentation of entities and relationships. That type of diagrams is often used in the semi-structured or unstructured data in databases and information systems. At first glance ERD is similar to a flowch
Entity Relationship Diagram Software

Relationships Analysis

Entity Relationship Diagram Examples


Entity Relationship Diagram Software Engineering

Entity-Relationship Diagram (ERD) with ConceptDraw DIAGRAM

- Inter Relationship Of Carbohydrate Fat And Protein Flow Chart
- Interrelationship Diagram Wikipedia
- Describe The Metabolic Inter Relationship Between Proteins Fats ...
- Inter Relationship Digraph Tool
- Interrelationship Diagram
- Interrelationship Diagrams
- Inter Relationship Between Carbohydrate Fat Protein Metabolism
- Interrelationship Between Carbohydrate Protein And Fat Metabolism ...
- Interrelationship Digraph
- Relationship In The Metabolism Of Carbohydrates Protein And Fat