ConceptDraw Arrows10 Technology
Using any other connection point provides a static connection, when you move connected objects the connector stays attached to the same point.
HelpDesk
How to Use ConceptDraw Single User License

HelpDesk
How to Draw a Line Chart Quickly

 Office Layout Plans
Office layouts and office plans are a special category of building plans and are often an obligatory requirement for precise and correct construction, design and exploitation office premises and business buildings. Designers and architects strive to make office plans and office floor plans simple and accurate, but at the same time unique, elegant, creative, and even extraordinary to easily increase the effectiveness of the work while attracting a large number of clients.
Banquet Hall Plan Software

ConceptDraw DIAGRAM provides Cafe and Restaurant Plans solution from the Building Plans Area of ConceptDraw Solution Park.
HelpDesk
How to Customize Columns in Your Project Schedule

HelpDesk
How to Draw a Fire Evacuation Plan for Your Office
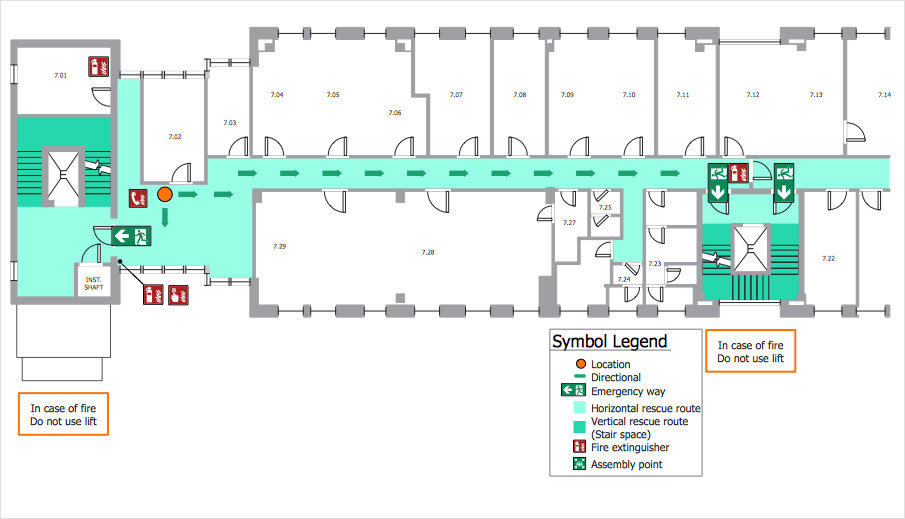
Emergency Floor Plan diagram presents a set of standard symbols used to depict fire safety, emergency, and associated information. Using clear and standard symbols on fire emergency plans delivers the coherence of collective actions, helps to avoid embarrassment and improves communications in an emergent situation. The fire emergency symbols are intended for the general emergency and fire service, as well as for building plans, engineering drawings, and insurance diagrams. They can be used during fire extinguishing and evacuation operations, as well as training. It includes vector symbols for emergency management mapping, emergency evacuation diagrams and plans. You can use ConceptDraw DIAGRAM to make the fire evacuation plans for your office simple, accurate and easy-to-read.
HelpDesk
How to Draw the Different Types of Pie Charts

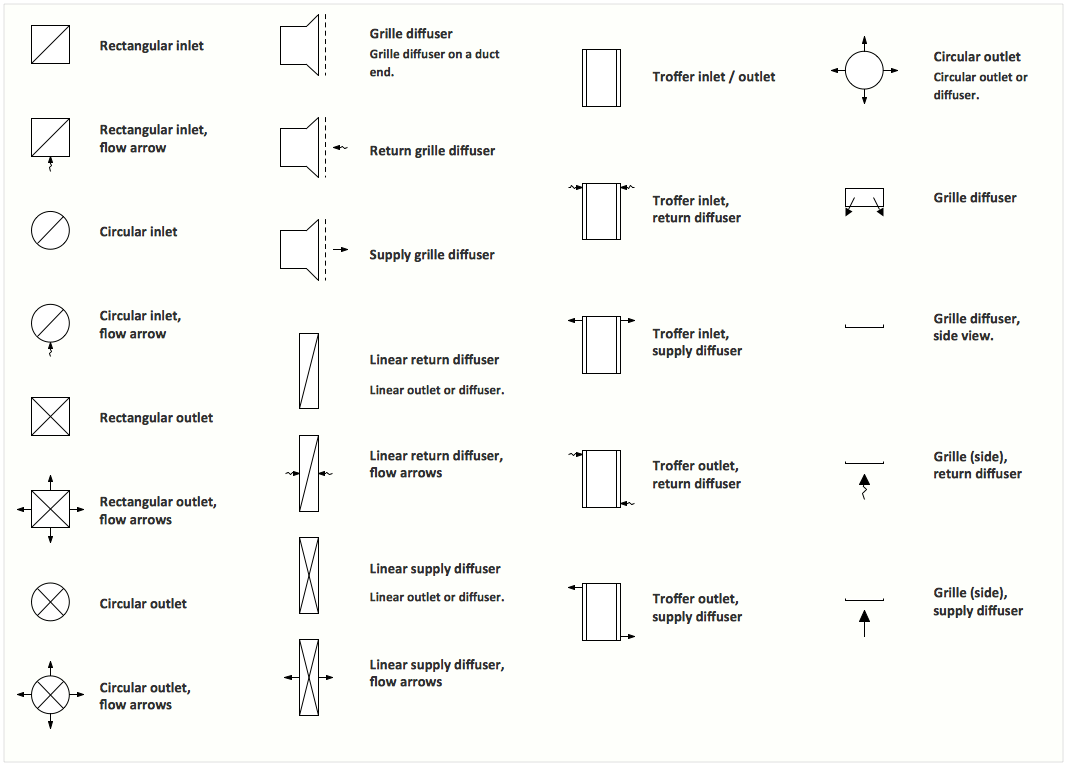
Interior Design. Registers, Drills and Diffusers — Design Elements
Bubble diagrams with ConceptDraw DIAGRAM

HelpDesk
How to Create a Bar Chart

The bar graph can be vertical or horizontal. This depends on the number of categories. There are many methods in which bar graph can be built and this makes it a very often used chart type. Usually, a bar chart is created so that the bars are placed vertically. Such an arrangement means that the bar's height value is proportional to the category value. Nevertheless, a bar chart can be also drawn horizontally. This means that the longer the bar, the bigger the category. Thus, a bar chart is a good way to present the relative values of different measured items. The ConceptDraw Bar Graphs solution allows you to draw a bar chart quickly using a vector library, containing the set of various bar charts objects.
HelpDesk
How to Add and Edit Connector Text

HelpDesk
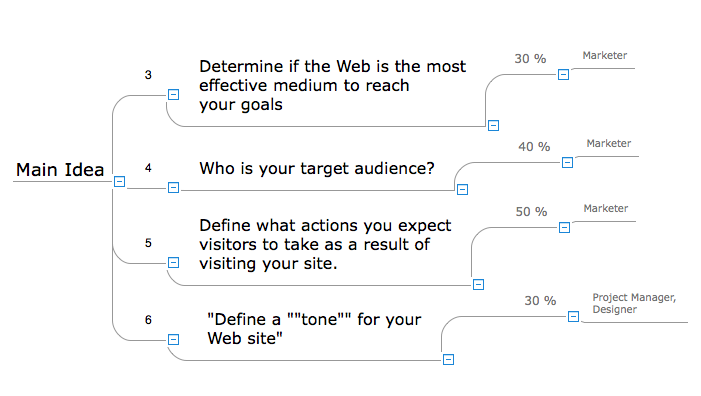
How to Input Data from MS Excel Into a Mind Map
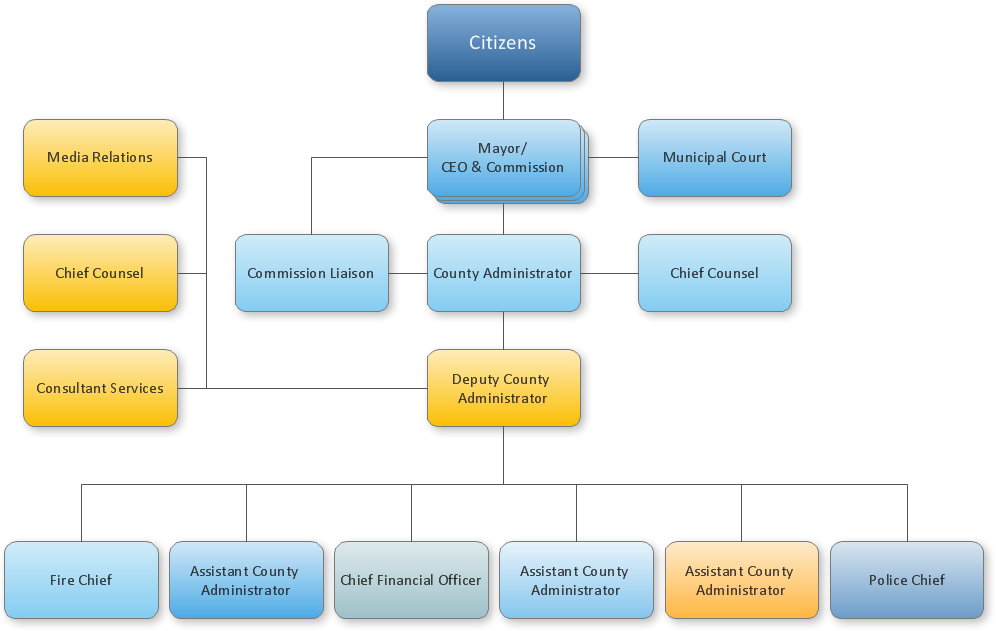
- Draw An Organisational Chart Of Office Management
- How to Draw an Organization Chart | Product Overview | Product ...
- How to Draw an Organization Chart | How to Draw a Bubble Chart ...
- How to Draw an Organization Chart | CORRECTIVE ACTIONS ...
- Building Drawing Software for Design Office Layout Plan ...
- Conceptdraw Office Organizational Chart
- Diagram Of An Organizational Structure Of An Office
- Office Organizational Chart
- The Office Organizational Chart
- Office Organization Chart
- How to Draw an Organization Chart | Organizational Charts | How to ...
- How Does An Office Build An Organizational Structure
- Building Drawing Software for Design Office Layout Plan | How To ...
- Draw An Organisational Chart Of An Office
- Information Technology Organizational Chart
- Organizational Charts with ConceptDraw PRO | Responsibility ...
- Organizational Structure | How to Draw an Organization Chart ...
- Office Layout Plans | Building Drawing Software for Design Office ...
- How to Draw an Organization Chart | Block diagram - Types of ...
- How to Draw an Organization Chart | Orgchart | Organizational ...
- ERD | Entity Relationship Diagrams, ERD Software for Mac and Win
- Flowchart | Basic Flowchart Symbols and Meaning
- Flowchart | Flowchart Design - Symbols, Shapes, Stencils and Icons
- Flowchart | Flow Chart Symbols
- Electrical | Electrical Drawing - Wiring and Circuits Schematics
- Flowchart | Common Flowchart Symbols
- Flowchart | Common Flowchart Symbols