 Organizational Charts
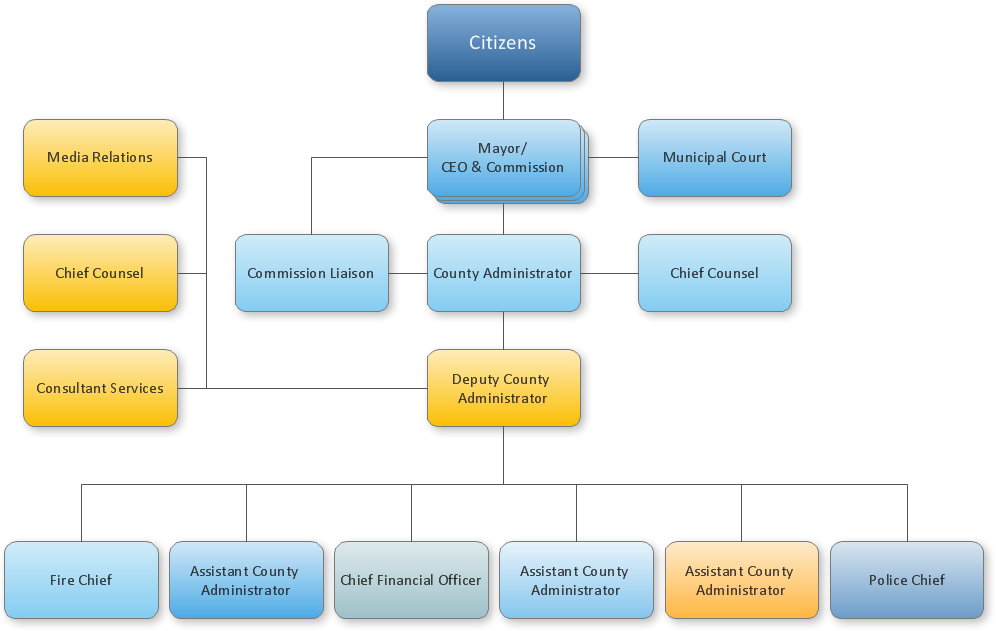
Organizational Charts solution extends ConceptDraw PRO software with samples, templates and library of vector stencils for drawing the org charts.
 25 Typical Orgcharts
The 25 Typical Orgcharts solution contains powerful organizational structure and organizational management drawing tools, a variety of professionally designed organization chart and matrix organization structure samples, 25 templates based on various orga
ConceptDraw Arrows10 Technology
When using a shapes′ center connection the connection becomes dynamic, the connector will trace the contour of the object, when moving the object inside your diagram. Using any other connection point provides a static connection, when you move connected objects the connector stays attached to the same point.HelpDesk
How to Create a Fault Tree Analysis Diagram (FTD) in ConceptDraw PRO
Fault Tree Diagram are logic diagram that shows the state of an entire system in a relationship of the conditions of its elements. Fault Tree Diagram are used to analyze the probability of functional system failures and safety accidents. ConceptDraw PRO allows you to create professional Fault Tree Diagrams using the basic FTD symbols. An FTD visualize a model of the processes within a system that can lead to the unlikely event. A fault tree diagrams are created using standard logic symbols . The basic elements in a fault tree diagram are gates and events.HelpDesk
How To Create Root Cause Analysis Diagram Using ConceptDraw Office
Root Cause Analysis (RCA) is used to determine the main causes of the problem. If the certain factor is the root cause, this mean that its vanishing will help to prevent the further recurrence of the problem. Root Cause Analysis diagram is used to analyze the root causes of factors that influence the problem. It helps to identify the root causes for a factor and then propose possible corrective actions. A diagram is constructed separately for each high priority factor. The ability to create a RCA tree diagram from a mind map is supported by the ConceptDraw Seven Management and Planning Tools solution.
 ConceptDraw Solution Park
ConceptDraw Solution Park collects graphic extensions, examples and learning materials
HelpDesk
How to Manage Problem Solving Using Seven Management and Planning Tools
Stage by stage gouide on using visual tools to move toward solving the problem.
What is a Cross Functional Flow Chart?
For those who want to know what is a cross functional flowchart and how to draw it, we preared a special library and professional looking templates. Take all the advantage of your drawing software to learn and create such a well-designed flowcharts. Watch the HowTo video to learn more.
 Business Processes Area
Solutions of Business Processes area extend ConceptDraw PRO software with samples, templates and vector stencils libraries for drawing business process diagrams and flowcharts for business process management.
HelpDesk
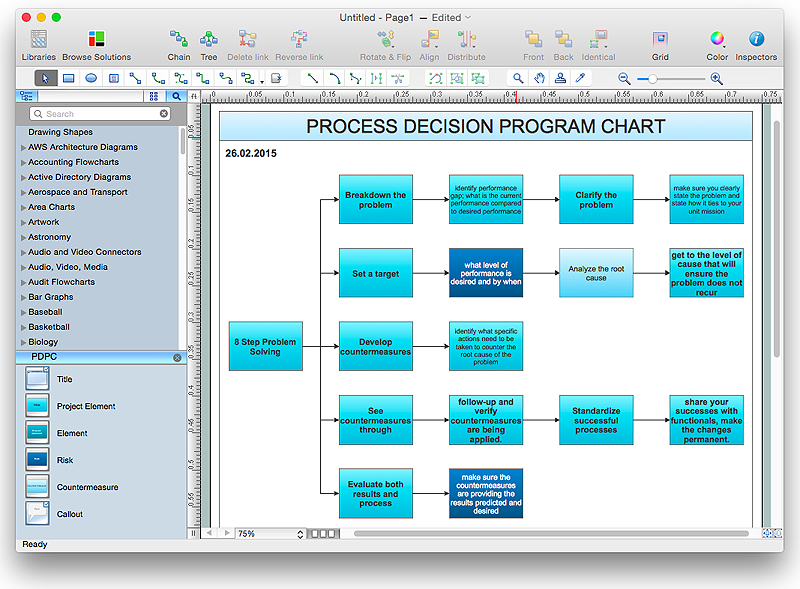
How To Create Risk Diagram (PDPC)
Article on how to identify possible risks when carrying out corrective actions, and define preventive actions
- How to Draw an Organization Chart | Orgchart | Organization Chart ...
- How to Draw an Organization Chart | Organizational Structure ...
- Organizational Structure | Process Flowchart | Basic Flowchart ...
- Cause & Effect Analysis | Organizational Chart Template | Fault Tree ...
- How to Draw an Organization Chart | Organizational Structure ...
- Data structure diagram with ConceptDraw PRO | Organizational ...
- Organizational Structure | Process Flowchart | How to Draw an ...
- How to Draw an Organization Chart | ConceptDraw PRO ...
- Organizational Structure | How to Draw an Organization Chart ...
- Decision Making | Management | How to Create Organizational ...
- Organization Chart Software | Organizational Chart | Organization ...
- How To Draw Tree Flow In Ppt
- Process Flowchart | Organizational Structure | How to Draw an ...
- Organization Chart Software | Organizational Chart | Process ...
- Orgchart | Organizational Structure Diagram Software | Management ...
- Data structure diagram with ConceptDraw PRO | Organizational ...
- ConceptDraw PRO - Organizational chart software | How to Draw an ...
- How to Create Organizational Chart Quickly | Organizational ...
- Orgchart | How to Draw an Organization Chart | Organizational ...
- How to Draw an Organization Chart | Organizational Charts ...


