Onion Diagram Maker

ConceptDraw DIAGRAM diagramming and vector drawing software extended with Stakeholder Onion Diagrams Solution from the Management Area of ConceptDraw Solution Park is a professional Onion Diagram Maker.
How To Create Onion Diagram

But how to create Onion Diagram? Now, it's very easy thanks to the ConceptDraw DIAGRAM diagramming and vector drawing software extended with Stakeholder Onion Diagrams Solution from the Management Area of ConceptDraw Solution Park.
Onion Diagram Process Design

ConceptDraw DIAGRAM diagramming and vector drawing software supplied with Stakeholder Onion Diagrams Solution from the Management Area of ConceptDraw Solution Park is an ideal software for effective Onion diagram process design.
Stakeholder Onion Diagrams

Design fast and easy Stakeholder Onion Diagrams of any complexity in ConceptDraw DIAGRAM diagramming and vector drawing software using the powerful tools of Stakeholder Onion Diagrams Solution from the Management Area of ConceptDraw Solution Park.
Onion Diagram Templates

Design of Onion Diagrams and Stakeholder Onions Diagrams is a complex process, but ConceptDraw DIAGRAM diagramming and vector drawing software makes it easier thanks to the Stakeholder Onion Diagrams Solution from the Management Area of ConceptDraw Solution Park, and the set of included libraries and Onion Diagram templates.
Stakeholder Onion Diagram Template

Stakeholder Management System

ConceptDraw DIAGRAM is a powerful diagramming and vector drawing software. Now, thanks to the Stakeholder Onion Diagrams Solution included to the Management Area of ConceptDraw Solution Park, ConceptDraw DIAGRAM became also unique stakeholder management system design software.
Stakeholder Mapping Tool

ConceptDraw DIAGRAM diagramming and vector drawing software extended with Stakeholder Onion Diagrams Solution from the Management Area of ConceptDraw Solution Park is a powerful stakeholder mapping tool which allows easy create Stakeholder Onion diagrams and maps depicting the layers of a project, relationships of stakeholders to a project goal, and relationships between stakeholders.
 Stakeholder Onion Diagrams
The Stakeholder Onion Diagram is often used as a way to view the relationships of stakeholders to a project goal. A basic Onion Diagram contains a rich information. It shows significance of stakeholders that will have has influence to the success achieve
TQM Software — Build Professional TQM Diagrams

Visualize Stakeholder Analysis

Use the ConceptDraw DIAGRAM diagramming and vector drawing software enhanced with powerful tools of Stakeholder Onion Diagrams Solution from the Management Area of ConceptDraw Solution Park to easy and effectively visualize stakeholder analysis.
Affinity Diagram

Organizational Structure Diagram Software
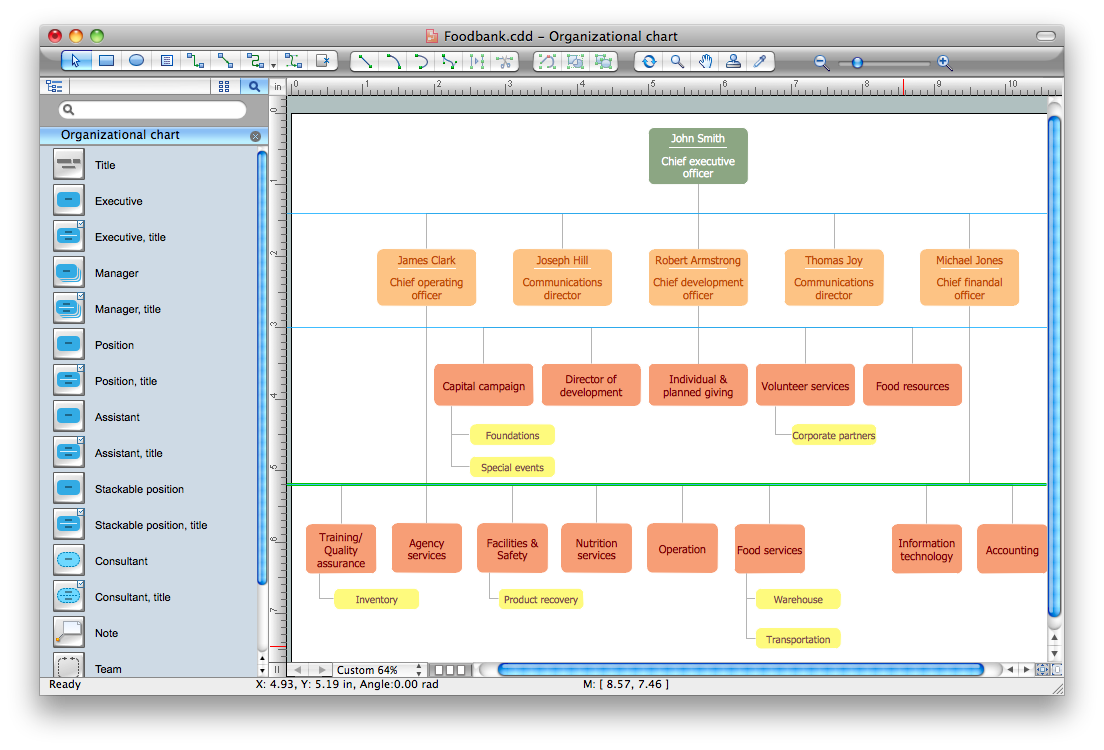
Organizational Charts Solution provides a wide variety of templates and samples and large quantity of predesigned vector objects to help you design your Organizational Structure Diagrams and other business diagrams.

Business diagrams & Org Charts with ConceptDraw DIAGRAM


Pyramid Diagram

- Onion Diagram Maker | Venn Diagram Maker | Bubble Chart Maker ...
- Onion Diagram Maker | How To Create Onion Diagram | Onion ...
- Onion Diagram Maker | Stakeholder Management System ...
- Management Stakeholder Onion Diagrams
- Venn Diagram Maker | Venn Diagrams | Onion Diagram Maker ...
- Stakeholder Onion Diagram Template | Stakeholder Mapping Tool ...
- Onion Diagram Process Design | How To Create Onion Diagram ...
- How To Create Onion Diagram | Onion Diagram Process Design ...
- How To Create Onion Diagram | Stakeholder Onion Diagrams ...
- Process Flowchart | Stakeholder Onion Diagrams | Onion Diagram ...
- Seating Chart Template Free | Organizational Chart Templates ...
- Onion Diagram Maker | Network Diagram Software LAN Network ...
- Concept Map Maker | Onion Diagram Maker | Stakeholder Mapping ...
- Bubble Chart Maker | Onion Diagram Maker | Bar Chart Software ...
- Stakeholder Onion Diagram Template | Venn Diagram Template ...
- How To Create Onion Diagram | Onion Diagram Maker | eLearning ...
- Stakeholder Management System | Onion Diagram Maker ...
- Onion Diagram Maker | Venn Diagram Maker | Flow Chart Creator ...
- Onion Diagram Maker | Matrix Organization | The Circular Flow ...
- Onion Diagram Maker | Pyramid Diagram | PM Easy | Draw The ...
- ERD | Entity Relationship Diagrams, ERD Software for Mac and Win
- Flowchart | Basic Flowchart Symbols and Meaning
- Flowchart | Flowchart Design - Symbols, Shapes, Stencils and Icons
- Flowchart | Flow Chart Symbols
- Electrical | Electrical Drawing - Wiring and Circuits Schematics
- Flowchart | Common Flowchart Symbols
- Flowchart | Common Flowchart Symbols