This site uses cookies. By continuing to browse the ConceptDraw site you are agreeing to our Use of Site Cookies.

Onion Diagram Maker

The onion diagram is a type of diagram which shows the dependencies among parts of an organization or process. The items are displayed at the concentric circles, where the items at the bigger rings depend on the items at the smaller rings.
ConceptDraw DIAGRAM diagramming and vector drawing software extended with Stakeholder Onion Diagrams Solution from the Management Area of ConceptDraw Solution Park is a professional Onion Diagram Maker.

Matrix Organization

Different organizations have different organizational structures. Matrix organization is one of the most popular and widely used type of organizational structure. Use ConceptDraw DIAGRAM diagramming and vector drawing software extended with 25 Typical Orgcharts solution from the Management area of ConceptDraw Solution Park for fast and easy designing matrix organizational chart for your company.

The Circular Flow Diagram

ConceptDraw DIAGRAM diagramming and vector drawing software extended with Target and Circular Diagrams solution from the Marketing area of ConceptDraw Solution Park is perfect for the Circular Flow Diagram creating.

wireframe tools, wireframing, wire frame, website wireframe, interface design, wireframe examples Website Wireframe

wireframe tools, wireframing, wire frame, website wireframe, interface design, wireframe examples
The innovative Website Wireframe solution enhances the ConceptDraw DIAGRAM functionality with newest wireframe tools, libraries with variety of predesigned icons, symbols, buttons, graphics, forms, boxes, and many other vector elements, templates and professionally designed samples, which make it the best wireframing software. Website Wireframe solution gives you significant advantages when designing and maintaining websites, creating skeletal and content-free depictions of website structure, making website prototypes and planning the content arrangement before committing to design, also speeds up the processes of sketching, producing and sharing wireframe examples of website style and interface design.

SWOT Matrix Software

The SWOT Analysis solution from the Management area of ConceptDraw Solution Park contains set of examples, templates and vector design elements of SWOT and TOWS matrices. It helps you to quickly draw SWOT and TOWS analysis matrix diagrams using the best SWOT matrix software ConceptDraw DIAGRAM.

Business diagrams & Org Charts with ConceptDraw DIAGRAM

Business flowcharting tool helps you create a flowchart with minimal effort. With ConceptDraw you can make a flowchart, draw data flow diagrams, orgchart professional, process flow diagrams etc - without any prior knowledge or training.
Draw Business Process Diagrams

Venn Diagram Maker

ConceptDraw DIAGRAM diagramming and vector drawing software extended with Venn Diagrams solution from the "Diagrams" area of ConceptDraw Solution Park is a powerful Venn Diagram maker. Create fast and easy your own Venn Diagrams to visualize: all the possible logical relations between sets, simple set relationships in logic, statistics, mathematics, sociology, marketing, summarize the status and future viability of a project.

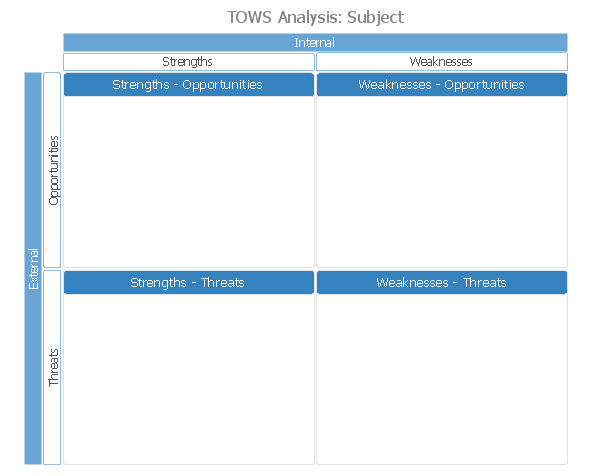
TOWS Analysis Software

TOWS analysis is a method of strategic analysis which is oriented on the study of the threats (T) which are danger for the company and new opportunities (O) which are closely connected with weaknesses (W) and strengths (S) sides of its activity.
ConceptDraw DIAGRAM diagramming and vector drawing software extended with SWOT and TOWS Matrix Diagrams Solution from the Management Area is the best for realization TOWS analysis and for quick and easy construction TOWS Matrix.

microsoft azure, windows azure, azure management, azure storage, azure blob storage, azure services Azure Architecture

microsoft azure, windows azure, azure management, azure storage, azure blob storage, azure services
Azure Architecture solution bundles into one handy tool everything you need to create effective Azure Architecture diagrams. It adds the extra value to versatile ConceptDraw DIAGRAM software and extends the users capabilities with comprehensive collection of Microsoft Azure themed graphics, logos, preset templates, wide array of predesigned vector symbols that covers the subjects such as Azure management, Azure storage, and Azure services, amongst others, and allow you to illustrate Azure Architecture diagrams at any degree of complexity, to present visually your Azure cloud system architecture with professional style, to design Azure cloud topology, to document Windows Azure Architecture and Azure Cloud System Architecture, to visualize the great abilities and work of Microsoft Azure Cloud System and Azure services.

Lean Six Sigma Diagram Software

Lean Six Sigma (LSS) is a well-known in all over the world methodology of quality improvement and business perfection. ConceptDraw DIAGRAM diagramming and vector drawing software is a powerful Lean Six Sigma Diagram Software thanks to the included Value Stream Mapping solution from the Quality Management Area of ConceptDraw Solution Park.

Organizational Chart

An organizational chart is a diagram that shows the structure of an organization and the relationships of its parts. ConceptDraw DIAGRAM extended with Organizational Charts Solution from the Management Area is powerful Organizational Chart Software.

table seating chart template, seating charts template, template for seating chart, the seating arrangement, seating arrangement chart, seat plan, seating chart templates? Seating Plans

table seating chart template, seating charts template, template for seating chart, the seating arrangement, seating arrangement chart, seat plan, seating chart templates?
The Seating Plans solution including samples, seating chart templates and libraries of vector design elements assists in creating the Seating plans, Seating arrangement charts, Chair layout designs, Plan drawings of cinema seating, Movie theater chair plans, extensive Cinema theater plans depicting the seating arrangement in the cinema halls, location of closet, cafe and food sale area, in designing the Seating plans for the large seating areas, Seat plan designs for airplanes, trains, etc. Use any of the included samples as the table seating chart template or seating chart template free and achieve professional drawing results in a few minutes.

Fishbone Problem Solving

The knowledge and ability to apply various strategies for dealing with problems and difficult situations is very useful in many areas. The Fishbone strategy is one of the most progressive. This graphical technique helps to identify possible causes of problems, to set the goals, and also show internal connections between the different parts of problem. After reviewing all causes and facts, you can easily find right solution.
ConceptDraw DIAGRAM diagramming and vector drawing software extended with Fishbone Diagrams Solution from the Management Area of ConceptDraw Solution Park is a powerful Fishbone Problem Solving tool.

Cause and Effect Diagram Software

The Cause and Effect diagram introduced by Kaoru Ishikawa in 1968 is a method for analyzing process dispersion. It can help you to dive into a problem and find an effective solution, identify and represent the possible causes for an effect, analyze the complex business problems and successfully solve them.
You can design your Cause and Effect diagram on a paper, but more effective way is to use specific software - ConceptDraw DIAGRAM is a powerful Cause and Effect Diagram Software. It helps you create Cause and Effect diagram known also as Fishbone diagram or Ishikawa diagram from templates and examples.

information graphics, infographics tool Infographics Area

information graphics, infographics tool
Solutions of the area What is Infographics from ConceptDraw Solution Park collect templates, samples and vector stencils libraries with design elements for the drawing information graphics.