Human Resource Management

Example of Flowchart Diagram

Matrix Organization Structure

Now we have ConceptDraw DIAGRAM diagramming and vector drawing software extended with 25 Typical Orgcharts solution from the Management area of ConceptDraw Solution Park which will help easy represent matrix organizational structure of any degree of complexity.
Total Quality Management Business Diagram

Pyramid Diagram

What is a Quality Management

Software for Drawing EPC Diagrams

ConceptDraw DIAGRAM - software that reduces the time needed to create a business process model.
Quality Improvement

Recruitment

The recruitment process often requires design and use of various HR flowcharts, diagrams, attractive illustrations. Never before their creation wasn’t so easy as now with HR Flowcharts Solution from the Management Area of ConceptDraw Solution Park.
Competitor Analysis

Campus Area Networks (CAN). Computer and Network Examples
. <br>Computer and Network Examples *")
The elementary campus networks arise spontaneously: the radio signals from the access points, which provide network inside the building are not limited to its walls, so any user in the backyard can also get wireless network access. The larger and more complex campus network may have additional access points in places specially chosen for serving clients, i.e., on the lawn in front of the college or in a coffee shop around the corner.

A Study of the Business Value of Total Quality Management

Line Chart Examples

"Human resource management (HRM, or simply HR) is the management process of an organization's workforce, or human resources. It is responsible for the attraction, selection, training, assessment, and rewarding of employees, while also overseeing organizational leadership and culture and ensuring compliance with employment and labor laws. In circumstances where employees desire and are legally authorized to hold a collective bargaining agreement, HR will also serve as the company's primary liaison with the employees' representatives (usually a trades union).
HR is a product of the human relations movement of the early 20th century, when researchers began documenting ways of creating business value through the strategic management of the workforce. The function was initially dominated by transactional work, such as payroll and benefits administration, but due to globalization, company consolidation, technological advancement, and further research, HR now focuses on strategic initiatives like mergers and acquisitions, talent management, succession planning, industrial and labor relations, and diversity and inclusion." [Human resource management. Wikipedia]
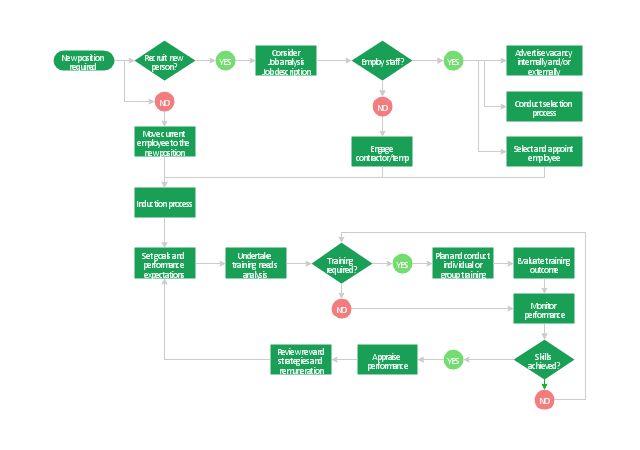
The flow chart example "HR management process" was created using the ConceptDraw PRO diagramming and vector drawing software extended with the Flowcharts solution from the area "What is a Diagram" of ConceptDraw Solution Park.
HR is a product of the human relations movement of the early 20th century, when researchers began documenting ways of creating business value through the strategic management of the workforce. The function was initially dominated by transactional work, such as payroll and benefits administration, but due to globalization, company consolidation, technological advancement, and further research, HR now focuses on strategic initiatives like mergers and acquisitions, talent management, succession planning, industrial and labor relations, and diversity and inclusion." [Human resource management. Wikipedia]
The flow chart example "HR management process" was created using the ConceptDraw PRO diagramming and vector drawing software extended with the Flowcharts solution from the area "What is a Diagram" of ConceptDraw Solution Park.
Flowchart - HR management process
Venn Diagram Examples for Problem Solving. Environmental Social Science. Human Sustainability Confluence

Create your Venn diagrams for problem solving in environmental social science using the ConceptDraw DIAGRAM diagramming and vector drawing software extended with the Venn Diagrams solution from the area "Diagrams" of ConceptDraw Solution Park.
 HR Flowcharts
Human resource management diagrams show recruitment models, the hiring process and human resource development of human resources.
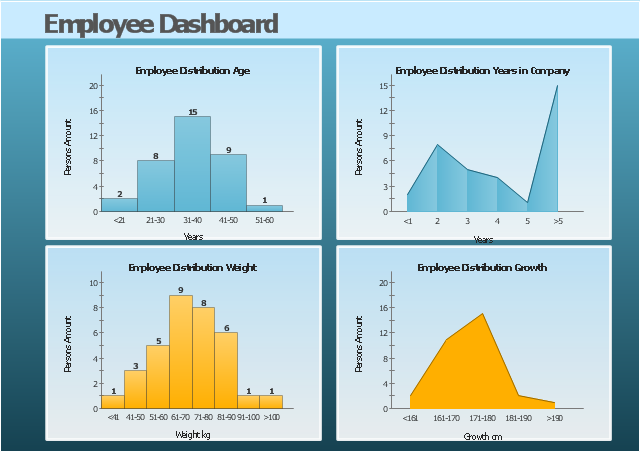
This HR dashboard example include histograms "Employee Distribution by Age" and "Employee Distribution by Weight", and area charts "Employee Distribution by Years in Company" and "Employee Distribution by Growth".
"Human resource management (HRM, or simply HR) is the management process of an organization's workforce, or human resources. It is responsible for the attraction, selection, training, assessment, and rewarding of employees, while also overseeing organizational leadership and culture and ensuring compliance with employment and labor laws. In circumstances where employees desire and are legally authorized to hold a collective bargaining agreement, HR will also serve as the company's primary liaison with the employees' representatives (usually a trades union)." [Human resource management. Wikipedia]
The example "Employee dashboard" was created using the ConceptDraw PRO diagramming and vector drawing software extended with the Frequency Distribution Dashboard solution from the area "What is a Dashboard" of ConceptDraw Solution Park.
Visual dashboard
 Flowcharts
The Flowcharts solution for ConceptDraw DIAGRAM is a comprehensive set of examples and samples in several varied color themes for professionals that need to represent graphically a process. Solution value is added by the basic flow chart template and shapes' libraries of flowchart notation. ConceptDraw DIAGRAM flow chart creator lets one depict the processes of any complexity and length, as well as design the Flowchart either vertically or horizontally.
Six Markets Model Chart Template

Onion Diagram Process Design

ConceptDraw DIAGRAM diagramming and vector drawing software supplied with Stakeholder Onion Diagrams Solution from the Management Area of ConceptDraw Solution Park is an ideal software for effective Onion diagram process design.
- HR symbols - Vector stencils library | Company's organizational ...
- HR symbols - Vector stencils library | Business - Vector stencils ...
- HR Flowchart Symbols | HR symbols - Vector stencils library | Map ...
- Business Process Modeling Notation | HR symbols - Vector stencils ...
- HR symbols - Vector stencils library | Design elements - HR symbols ...
- HR symbols - Vector stencils library | HR Flowchart Symbols ...
- HR management process - Flowchart | HR symbols - Vector stencils ...
- Organizational culture - Triangle diagram | 4 Level pyramid model ...
- HR Flowchart Symbols | How to Create a HR Process Flowchart ...
- Pyramid Diagram | Organizational culture - Triangle diagram ...
- HR symbols - Vector stencils library | HR symbols - Vector stencils ...
- Human Resource Management | Human Resources | HR symbols ...
- HR management process - Flowchart | HR Flowchart Symbols | HR ...
- HR symbols - Vector stencils library | Pyramid Diagram | HR symbols ...
- Employee needs | HR symbols - Vector stencils library | HR symbols ...
- Talent management process | Human Resource Management | HR ...
- Design elements - Conversations BPMN 2.0 | BPMN | How to Create ...
- Organizational culture - Triangle diagram | Organisational Triangle
- How to Supervise People | HR Flowcharts | HR Flowchart Symbols ...
- Organizational culture - Triangle diagram | ConceptDraw Arrows10 ...
- ERD | Entity Relationship Diagrams, ERD Software for Mac and Win
- Flowchart | Basic Flowchart Symbols and Meaning
- Flowchart | Flowchart Design - Symbols, Shapes, Stencils and Icons
- Flowchart | Flow Chart Symbols
- Electrical | Electrical Drawing - Wiring and Circuits Schematics
- Flowchart | Common Flowchart Symbols
- Flowchart | Common Flowchart Symbols