The Affinity Diagram shows the structure of complex factors that have an influence on a problem, and then divides them up into a smaller and simpler structure. This diagram is designed to prepare the data for further analysis of the cause-effect relationships.
TEN RELATED HOW TO's:
This sample shows the Flowchart that displays the layout and work flow of the cloud marketing platform. This diagram has a style of the marketing brochure. This style displays the central product that is related to the other issues.
Using the ready-to-use predesigned objects, samples and templates from the Flowcharts Solution for ConceptDraw DIAGRAM you can create your own professional looking Flowchart Diagrams quick and easy.
Picture: Flowchart Marketing Process. Flowchart Examples
Related Solution:
SWOT matrix templates is part of SWOT Analysis solution from ConceptDraw Solution Park.
Picture: SWOT matrix template
Any factory needs a clear scheme of all the equipment used in the manufacture processes. So, if you want to place all your machines and equipment on one diagram, you need a good diagramming tool for that. For instance, you can find all the design elements you might need, such as lathes, milling machines or saws on ConceptDraw DIAGRAM Solution Park in Plant Layout Plans solution in appropriate libraries.
This drawing represents the Machines and Equipment library delivered by ConceptDraw Plant Layout Plans solution. This vector library is supplied along with other libraries related to industrial architecture planning and interior design.
Just planning the proper facilities in a proper right place, allows to manufacture a product in the most effective and economic way. Objects containing in these libraries will be helpful for architects and engineers dealing with industrial buildings design. They are intended to use for designing layouts of plants, warehouses, manufacturing workshop etc.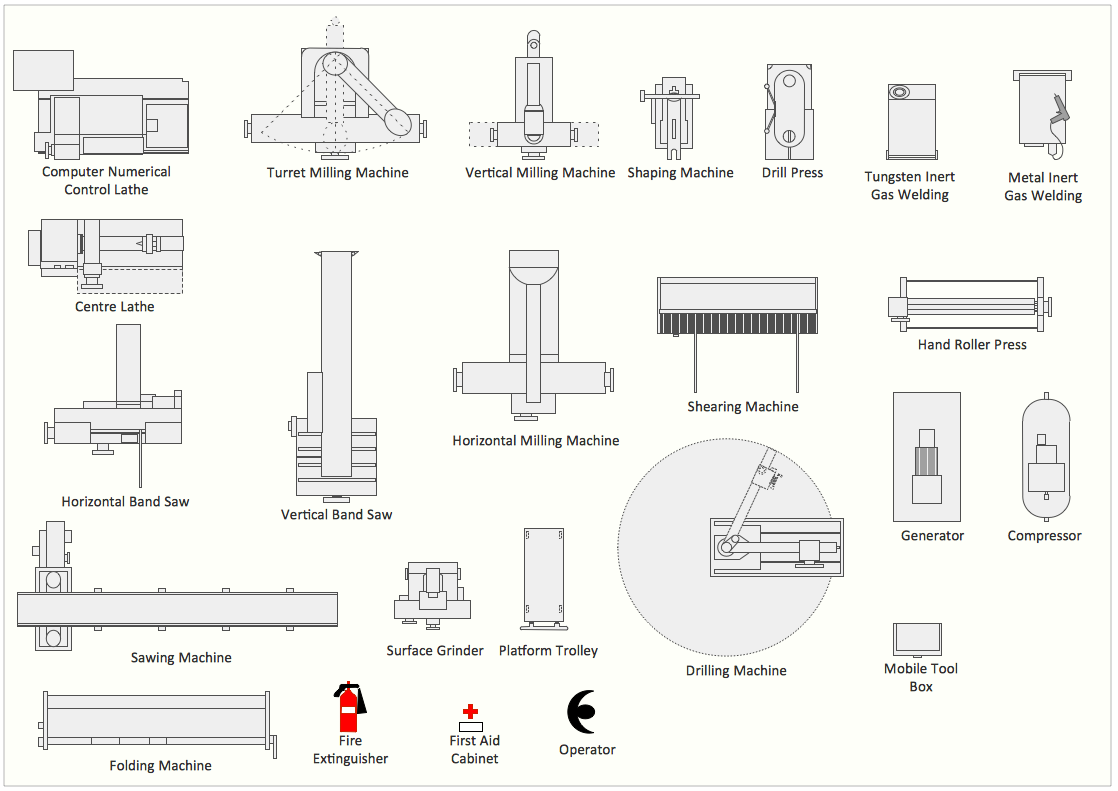
Picture: Interior Design. Machines and Equipment — Design Elements
Related Solution:
Event-Driven Process Chain Diagrams for improvement throughout an organisation.
ConceptDraw DIAGRAM - software that reduces the time needed to create a business process model.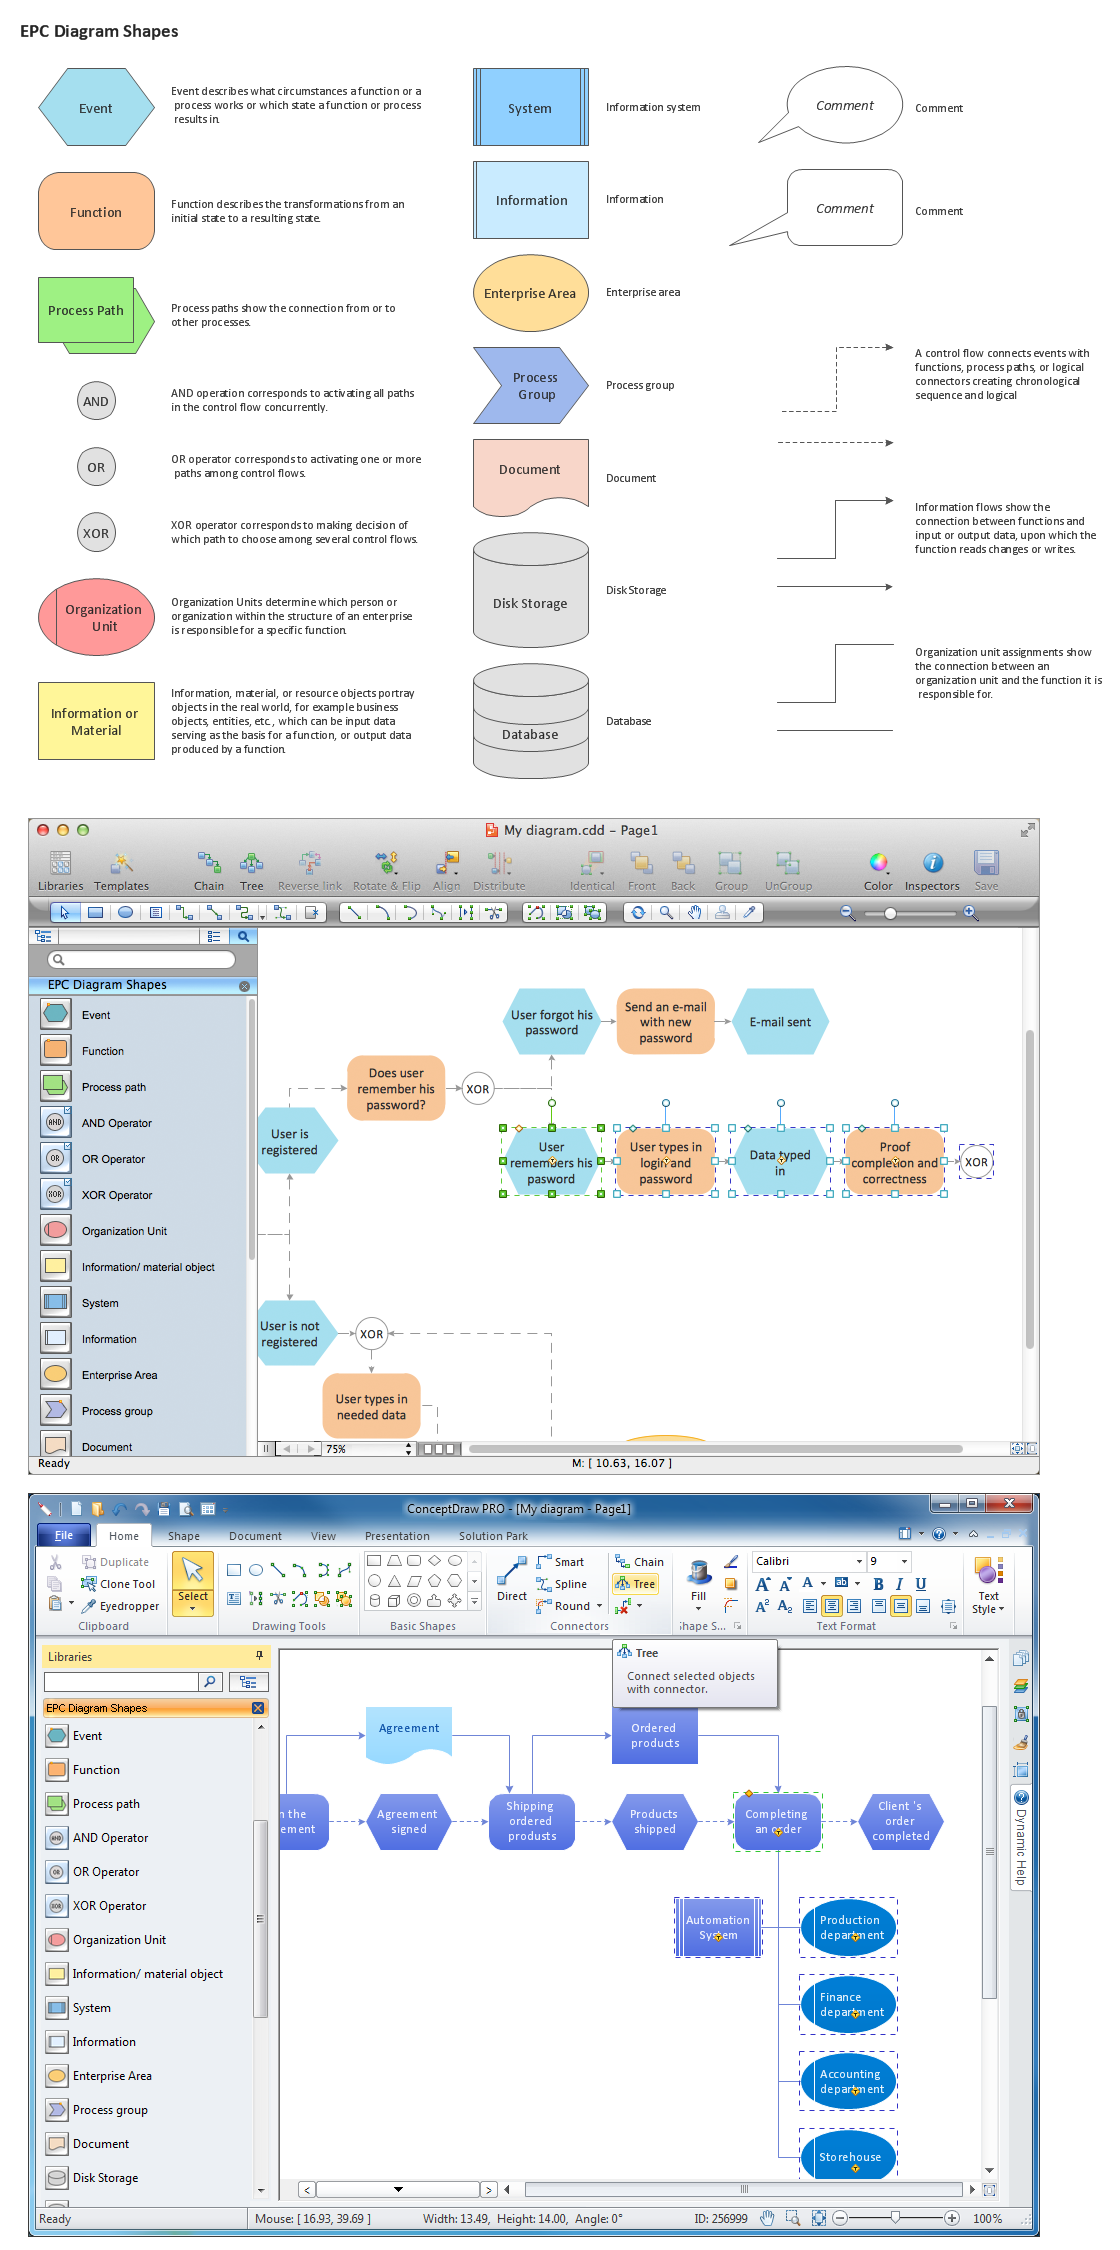
Picture: Structuring a business process as a chain of events and functions
Related Solution:
Many things can be listed as potential strengths and weaknesses of a company. To create a good-looking scheme, use SWOT analysis software and enjoy the results within a few minutes. A good practice is to make a SWOT analysis twice a year.
These drawings illustrate the possibilities of ConcptDraw solution for building SWOT and TOWS Matrices. SWOT analysis matrix demonstrates this widely used method for detection of Strengths and Weaknesses, Opportunities and Threats facing any business. If SWOT analysis is carried out properly, it can help to build a good position in the market. The ConceptDraw SWOT and TOWS Analysis solution provides a great number of templates of both SWOT and TOWS matrices. Moreover, this is the only software that offers to carry out SWOT analysis starting from making mind maps. The solution contains SWOT mind map templates. A single mouse click is needed to turn the SWOT mind map into a SWOT matrix. The SWOT diagram will be created in ConceptDraw DIAGRAM on the base of SWOT mind map.
Picture: SWOT Analysis Software: Comprehensive Guide
While creating flowcharts and process flow diagrams, you should use special objects to define different statements, so anyone aware of flowcharts can get your scheme right. There is a short and an extended list of basic flowchart symbols and their meaning. Basic flowchart symbols include terminator objects, rectangles for describing steps of a process, diamonds representing appearing conditions and questions and parallelograms to show incoming data.
This diagram gives a general review of the standard symbols that are used when creating flowcharts and process flow diagrams. The practice of using a set of standard flowchart symbols was admitted in order to make flowcharts and other process flow diagrams created by any person properly understandable by other people. The flowchart symbols depict different kinds of actions and phases in a process. The sequence of the actions, and the relationships between them are shown by special lines and arrows. There are a large number of flowchart symbols. Which of them can be used in the particular diagram depends on its type. For instance, some symbols used in data flow diagrams usually are not used in the process flowcharts. Business process system use exactly these flowchart symbols.
Picture: Flowchart Symbols: Meaning and Examples
Related Solution:
Different organizations have different organizational structures. Matrix organization is one of the most popular and widely used type of organizational structure. Use ConceptDraw DIAGRAM diagramming and vector drawing software extended with 25 Typical Orgcharts solution from the Management area of ConceptDraw Solution Park for fast and easy designing matrix organizational chart for your company.
Picture: Matrix Organization
Related Solution:
Gant Chart is a graphical representation of tasks as segments on a time scale. It helps plan and monitor project development or resource allocation. The horizontal axis is a time scale, expressed either in absolute or relative time.
Picture: Gant Chart in Project Management
Related Solution:
What is organizational charts and why your business need them? How to use business process diagram software? Explore how advanced organization chart software transforms the way companies ✔️ visualize, ✔️ communicate, and ✔️ streamline their organizational hierarchies
Picture:
What is an Organizational Chart and how it works?
Organization Chart Software
Related Solution:
There are three main types of organizational structures which can be adopted by organizations depending on their objectives: functional structure, divisional structure, matrix structure.
ConceptDraw DIAGRAM diagramming and vector drawing software enhanced with 25 Typical Orgcharts solution from the Management area of ConceptDraw Solution Park is ideal for designing diagrams and charts of any organizational structure types.
Picture: Organizational Structure Types
Related Solution:
