HelpDesk
How to Work with Custom Properties

HelpDesk
How to Edit Text on PC

How to Build Cloud Computing Diagram Principal Cloud Manufacturing

Electrical Diagram Software


HelpDesk
How to Resize Objects

Security Plans

SDL Flowchart Symbols

The vector stencils library "Instruments" contains 72 symbols of control instruments and measuring devices: meters and gauges, and callouts, text boxes, and inserts.
Use these shapes to create annotated process flow diagrams (PFD), flow control, manufacturing processes, and distribution system diagrams in the ConceptDraw PRO software extended with the Chemical and Process Engineering solution from the Chemical and Process Engineering area of ConceptDraw Solution Park.
www.conceptdraw.com/ solution-park/ engineering-chemical-process
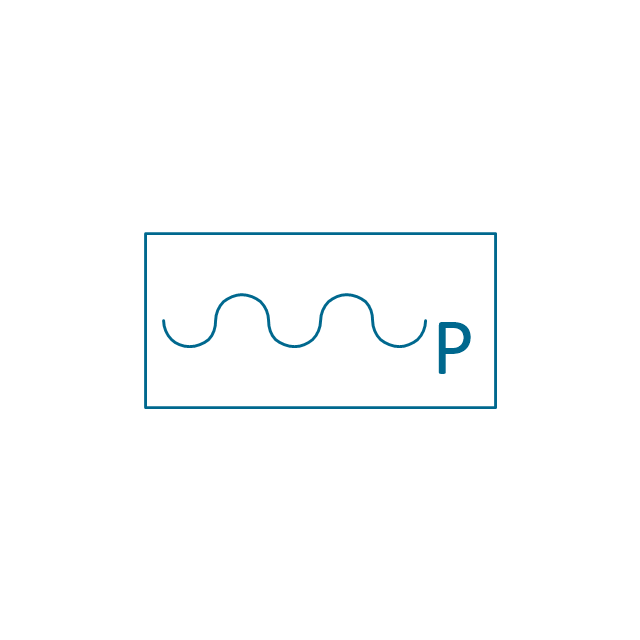
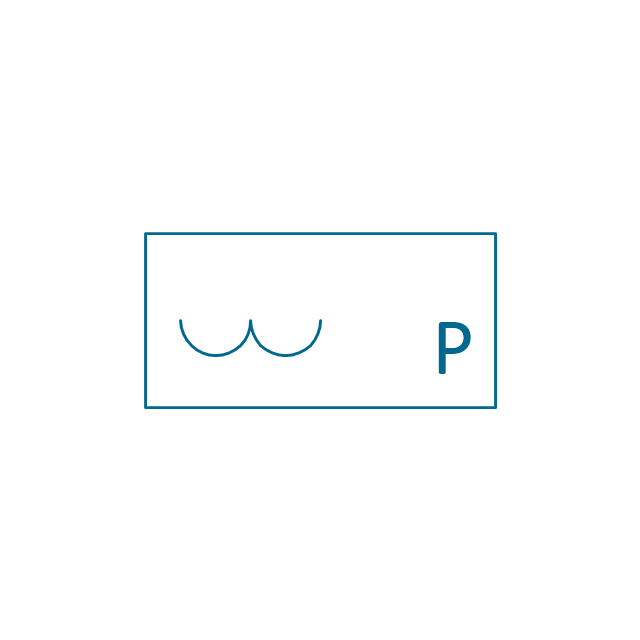
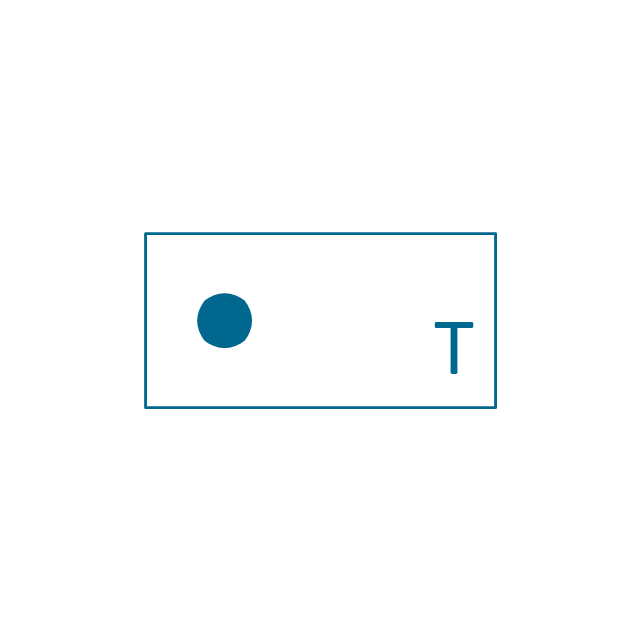
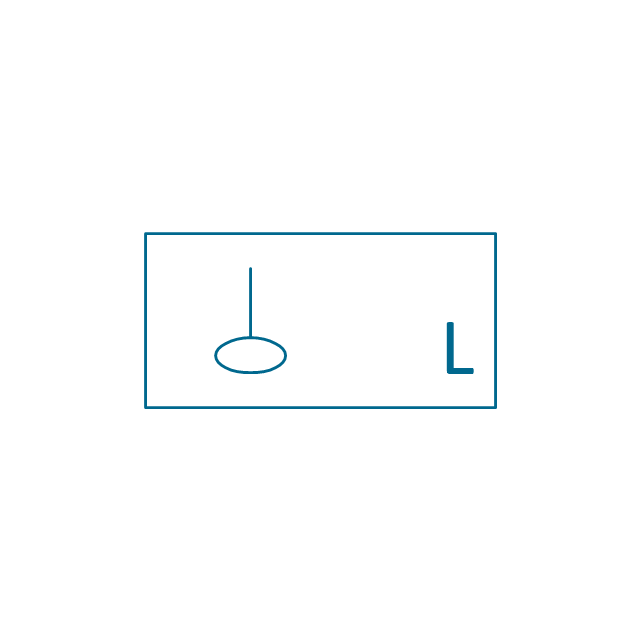
Indicator local

Indicator remote
Indicator auxiliary
CRT local

CRT remote
CRT auxiliary
PLC local

PLC auxiliary

PLC remote

Computer local

Computer auxiliary

Computer remote

Light local

Light remote
Light auxiliary
Indicator auxiliary (dashed)
-instruments---vector-stencils-library.png--diagram-flowchart-example.png)
Indicator remote (dashed)
-instruments---vector-stencils-library.png--diagram-flowchart-example.png)
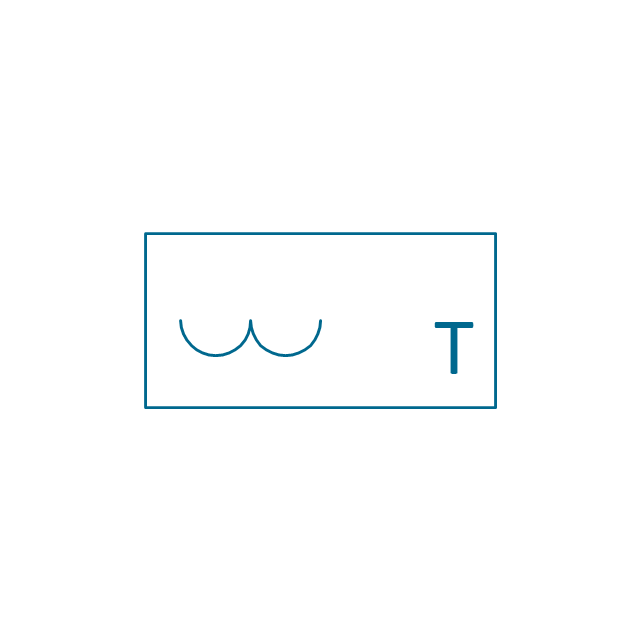
Steam traced auxiliary

Steam traced remote

Steam traced local

Level meter auxiliary
Level meter remote
Level meter local

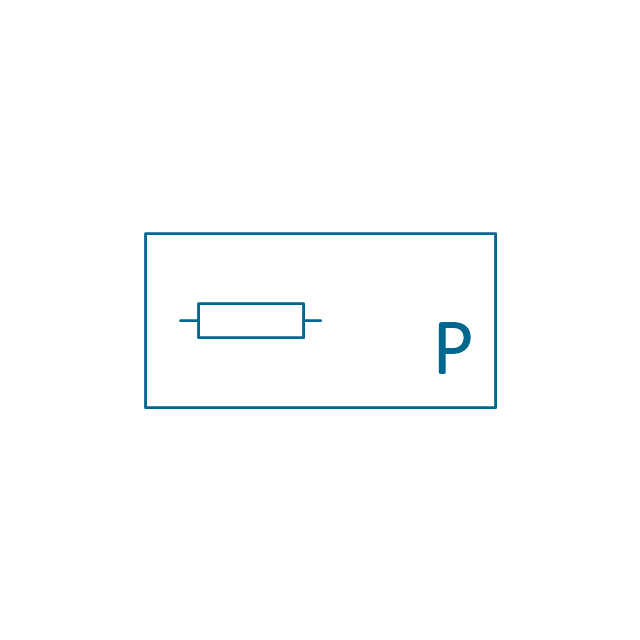
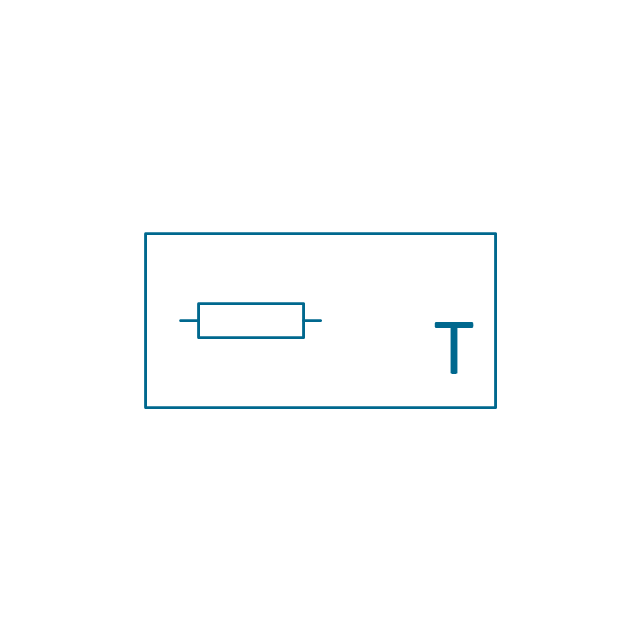
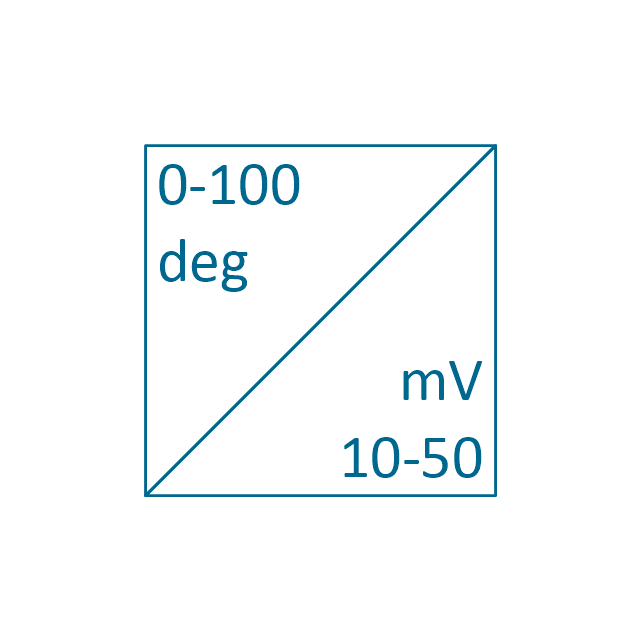
Pressure gauge diaphragm
Pressure gauge
Pressure gauge liquid filled
Strain gauge
Thermometer bi-metallic

Thermometer gas
Thermometer general

Thermometer glass

Thermometer liquid
Thermometer resistance
Thermometer thermocouple

Flowmeter electromagnetic
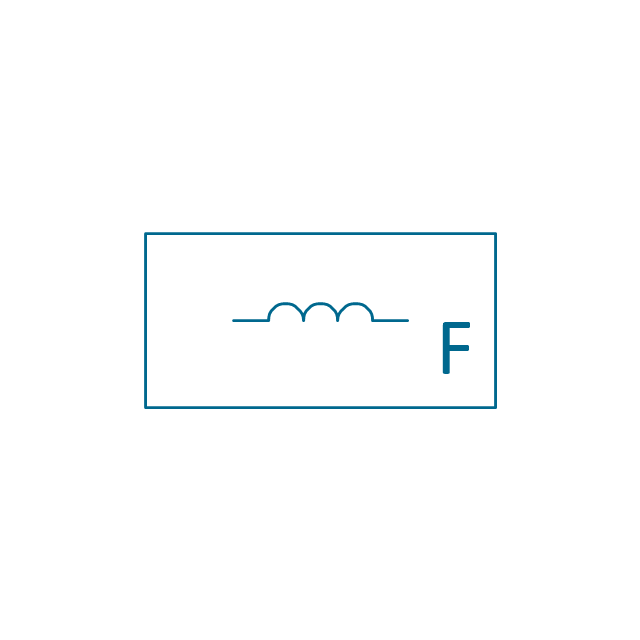
Flowmeter general

Flowmeter nozzle

Flowmeter orifice
Flowmeter positive displacement
Flowmeter turbine

Flowmeter variable area
Flowmeter Venturi

Level meter capacitive

Level meter conductive
Level meter displacer

Level meter float
Level meter general

Level meter sonic

Indicator analoque

Indicator digital
Indicator general

Recorder analoque

Recorder digital
Recorder general

Converter
Converter 2 (1st half filled)
-instruments---vector-stencils-library.png--diagram-flowchart-example.png)
Converter 3 (2nd half filled)
-instruments---vector-stencils-library.png--diagram-flowchart-example.png)
Venturi

Venturi (pressure taps)
-instruments---vector-stencils-library.png--diagram-flowchart-example.png)
Flowmeter

Rotameter
Vortex sensor

Propeller meter

Generic utility

Operator box

Operator box 2 (1st half filled)
-instruments---vector-stencils-library.png--diagram-flowchart-example.png)
Operator box 3 (2nd half filled)
-instruments---vector-stencils-library.png--diagram-flowchart-example.png)
AND gate

OR gate

NOT gate

Correcting element

Diamond

Sales Steps

Business Process Workflow Diagrams & Software


Basic of Flowchart: Meaning and Symbols


Network Topology Mapper

Keyboard Shortcuts and Mouse Actions

 Object-Role Modeling (ORM) Diagrams
Object-role Modeling (ORM) Diagram solution with powerful vector diagramming and data modeling tools, large quantity of specially developed samples and examples, and rich variety of vector objects corresponding to common ORM notation, ideally suits for developing the comprehensive, clear and visual Object-role Modeling (ORM) diagrams and schematics, understandable for all interested people from the different fields and business directions, for designing the ORM models, and demonstrating advantages from the use of ORM and its notation. It is intended for software developers and computer engineers, specialists in a field of Object-oriented programming (OOP), database architects, web-application constructors and developers, etc.
How to Create a Pyramid Diagram

The vector stencils library "Ribbon interface" contains 41 ribbon shapes.
Use it for designing Microsoft ribbon graphic user interface (GUI) of software for Windows computers in the ConceptDraw PRO diagramming and vector drawing software extended with the Graphic User Interface solution from the Software Development area of ConceptDraw Solution Park.
Use it for designing Microsoft ribbon graphic user interface (GUI) of software for Windows computers in the ConceptDraw PRO diagramming and vector drawing software extended with the Graphic User Interface solution from the Software Development area of ConceptDraw Solution Park.
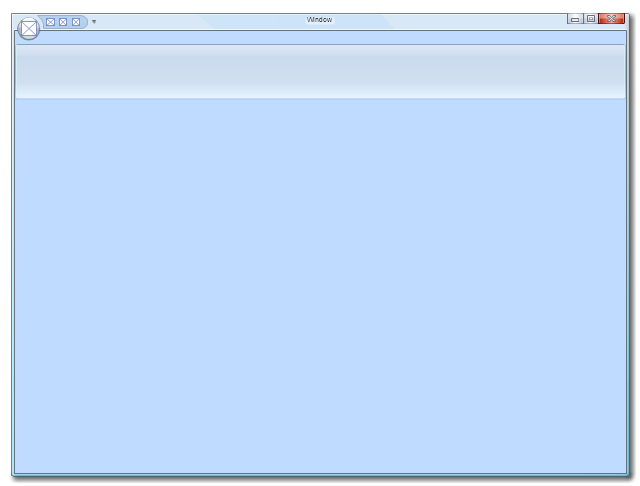
Main Window with Menu
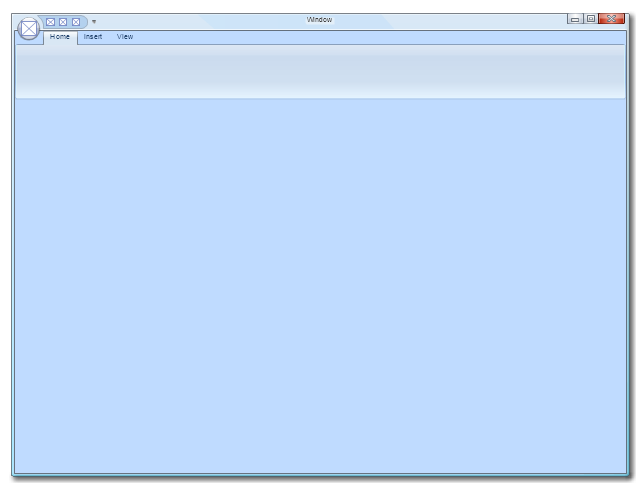
Main Window
Menu

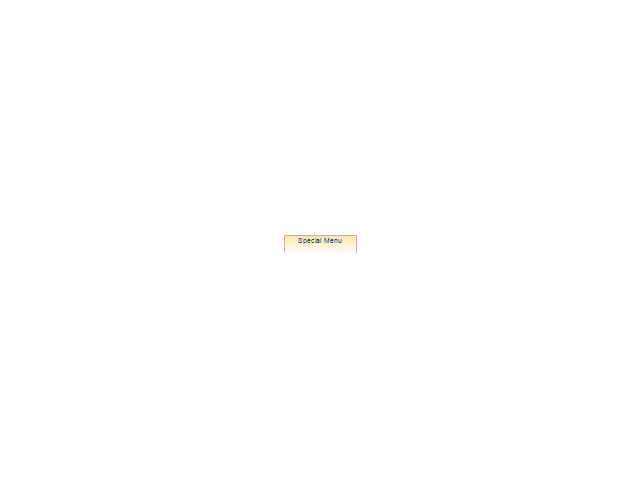
Special Menu
Field

Tools Group
Tools Group Minimized

Tool Button

Tool Button

Toolbar

Label

Text Label

Edit Box
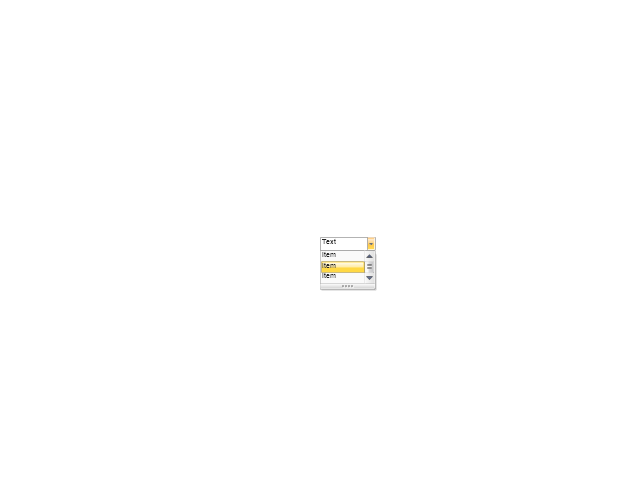
Combobox

Combobox with List
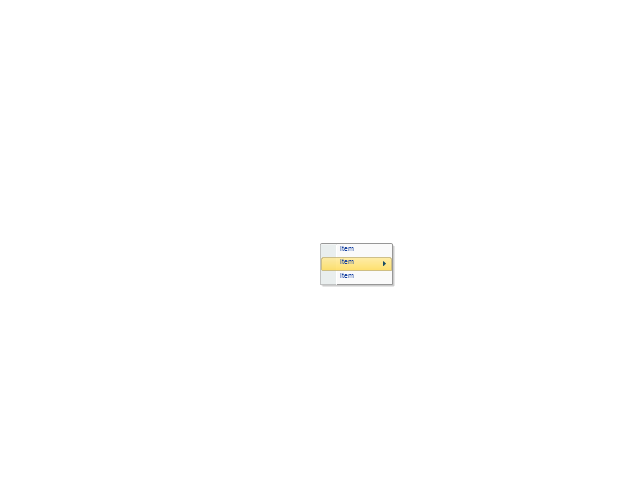
Drop-down Menu
Spin Box
Check Box

Radio Button

Styles Control 1

Styles Control 2

Rounded Tab

Floating Dialogue

Status Bar

Small Toolbar (for Status Bar)
-ribbon-interface---vector-stencils-library.png--diagram-flowchart-example.png)
Zoom Slider

Horizontal Scroll
Vertical Scroll
Drop-down List

Arrow
Close

Drop-down Menu Base

Drop-down Menu Left Part

Menu/List Item (Text)
-ribbon-interface---vector-stencils-library.png--diagram-flowchart-example.png)
Menu/List Item (Image)
-ribbon-interface---vector-stencils-library.png--diagram-flowchart-example.png)
Menu/List Item (Image with Text)
-ribbon-interface---vector-stencils-library.png--diagram-flowchart-example.png)
Meny/List Header

Drop-down Menu Separator

Vertical Separator

Chek/Option for Drop-down Menu

Image

How to create a UML Diagram

Flowchart Design Flowchart Symbols, Shapes, Stencils and Icons


HelpDesk
How to Connect Objects in ConceptDraw DIAGRAM on Windows

How to Draw EPC Diagram Quickly


- How to Add and Edit Text on Connectors | Swim Lane Diagrams ...
- Instruments - Vector stencils library | Bathroom | Visio Shape Nozzle
- How to Add a Block Diagram to a MS Word ™ Document Using ...
- Basic Flowchart Symbols and Meaning | Callout Box Examples
- Basic Flowchart Symbols and Meaning | On Page Reference In Visio
- Flowchart design. Flowchart symbols, shapes , stencils and icons ...
- Design elements - Callouts | Design elements - Callout blocks ...
- Design elements - Workflow arrows | Design elements - Circular ...
- Ribbon interface - Vector stencils library | Design elements ...
- ConceptDraw Arrows10 Technology | Rotate Object In Concept Draw