 Value Stream Mapping
Value stream mapping solution extends ConceptDraw DIAGRAM software with templates, samples and vector stencils for drawing the Value Stream Maps (VSM) in lean manufacturing practice.
Value Stream Mapping Software

Value Stream Mapping Template

Create a Value Stream Map Rapidly

How To create Value Stream Map (VSM)
 *")
VSM

Value Stream Mapping Examples

Value Stream Mapping Symbols

Value Stream Mapping

Learn how to create a current state value stream map

VSM Template

Quality Engineering Diagrams

Lean Manufacturing Diagrams

Porter's Value Chain

Cross-Functional Process Map Template

Cisco Icons

The vector stencils library "AWS Analytics" contains 22 icons: Amazon Athena icon, Amazon CloudSearch icons, Amazon EMR icons, Amazon ES icons, Amazon Kinesis icons, Amazon QuickSight icon, Amazon Redshift icons, AWS Data Pipeline icon, AWS Glue icon.
Use it to draw Amazon Web Services architecture diagrams with ConceptDraw PRO diagramming and vector drawing software.
"Amazon Elasticsearch Service is a managed service that makes it easy to deploy, operate, and scale Elasticsearch in the AWS Cloud. Elasticsearch is a popular open-source search and analytics engine for use cases such as log analytics, real-time application monitoring, and click stream analytics." [aws.amazon.com/ elasticsearch-service/ ]
"Amazon Elastic MapReduce (Amazon EMR) is a web service that makes it easy to quickly and cost-effectively process vast amounts of data." [aws.amazon.com/ elasticmapreduce/ ]
"Amazon Kinesis is a platform for streaming data on AWS, offering powerful services to make it easy to load and analyze streaming data, and also providing the ability for you to build custom streaming data applications for specialized needs." [aws.amazon.com/ kinesis/ ]
"Amazon Machine Learning is a service that makes it easy for developers of all skill levels to use machine learning technology." [aws.amazon.com/ machine-learning/ ]
"Amazon QuickSight is a very fast, cloud-powered business intelligence (BI) service that makes it easy for all employees to build visualizations, perform ad-hoc analysis, and quickly get business insights from their data." [aws.amazon.com/ quicksight/ ]
"AWS Data Pipeline is a web service that helps you reliably process and move data between different AWS compute and storage services, as well as on-premise data sources, at specified intervals." [aws.amazon.com/ datapipeline/ ]
The AWS icons example "Design elements - AWS Analytics" is included in the AWS Architecture Diagrams solution from the Computer and Networks area of ConceptDraw Solution Park.
Amazon Web Services icons
Near field communication (NFC). Computer and Network Examples
. <br>Computer and Network Examples *")

Business Diagram Software


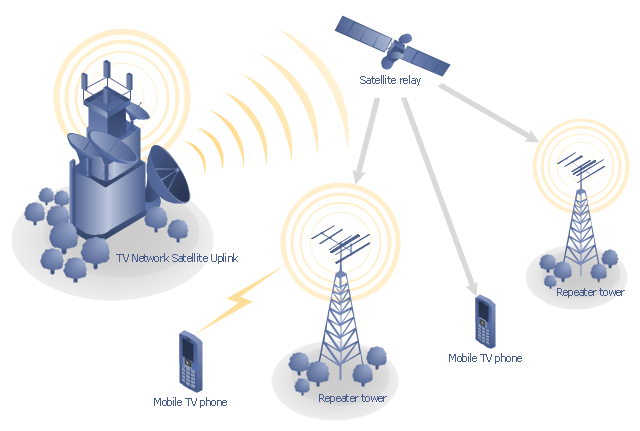
"Satellite television is television programming delivered by the means of communications satellite and received by an outdoor antenna, usually a parabolic reflector generally referred to as a satellite dish, and as far as household usage is concerned, a satellite receiver either in the form of an external set-top box or a satellite tuner module built into a TV set. Satellite TV tuners are also available as a card or a USB peripheral to be attached to a personal computer. In many areas of the world satellite television provides a wide range of channels and services, often to areas that are not serviced by terrestrial or cable providers.
Direct-broadcast satellite television comes to the general public in two distinct flavors - analog and digital. This necessitates either having an analog satellite receiver or a digital satellite receiver. Analog satellite television is being replaced by digital satellite television and the latter is becoming available in a better quality known as high-definition television." [Satellite television. Wikipedia]
"Mobile television is television watched on a small handheld or mobile device. It includes pay TV service delivered via mobile phone networks or received free-to-air via terrestrial television stations. Regular broadcast standards or special mobile TV transmission formats can be used. Additional features include downloading TV programs and podcasts from the internet and the ability to store programming for later viewing. ...
Mobile TV is among the features provided by many 3G phones." [Mobile television. Wikipedia]
"MobiTV, Inc. ... is a provider of end-to-end mobile media solutions. In 2011, the cloud-based MobiTV converged media platform delivered 1.6 billion minutes of live TV, video-on-demand and downloaded content for offline viewing to all tier-one wireless carriers and major mobile operating systems in the United States. ...
MobiTV furnishes programming from more than 40 television channels, offering live news and sports and a variety of full-episode on-demand shows for streaming or download on mobile devices, tablets, personal computers and other Internet-enabled consumer electronics.
MobiTV-powered TV services, which carry the operator’s brand, are accessible on hundreds of devices across multiple wireless carrier partners. ...
MobiTV’s converged media platform is an end-to-end managed service comprising components that work together to securely manage, deliver and play back video across devices both inside and outside the home." [MobiTV. Wikipedia]
This mobile satellite TV network diagram example was created using the ConceptDraw PRO diagramming and vector drawing software extended with the Telecommunication Network Diagrams solution from the Computer and Networks area of ConceptDraw Solution Park.
Mobile satellite TV diagram
- Value stream map - Template | How to Create a VSM Diagram Using ...
- Data Flow Diagram
- Dfd Of Video Streaming
- How To create Value Stream Map (VSM) | What is Value Stream ...
- Example of DFD for Online Store (Data Flow Diagram) | Audio ...
- Data Flow Diagram For Music Streaming
- Value Stream Mapping Symbols
- VSM Template | Value Stream Mapping Template | Value stream ...
- Value Stream Mapping Template
- Value Stream Mapping | VSM Template | Value stream map ...
- Value Stream Mapping
- Lean Manufacturing Diagrams | Value Stream Mapping | Types of ...
- Porter's Value Chain | Value stream map - Template | Matrices ...
- Value Stream Mapping | Value Stream Mapping Template | Process ...
- Cross-Functional Process Map Template | Value Stream Mapping ...
- Value Stream Mapping | Flow Map | How to Create a VSM Diagram ...
- Porter's Value Chain | VSM | Process Flowchart | Value Chain Visio
- Er Diagrams For Online Health Card System
- Er Diagram Of Online Video Streaming
- Process Flowchart | Advertising creation process - Conversation ...