Create a Value Stream Map Rapidly
The Value Stream Mapping solution from ConceptDraw Solution Park extends ConceptDraw DIAGRAM software with a new library that contains vector objects, samples and templates. With this well-designed vector objects users can draw Value Stream Mapping diagram. Also users can export resulting document to PDF, PowerPoint, and popular graphic formats.
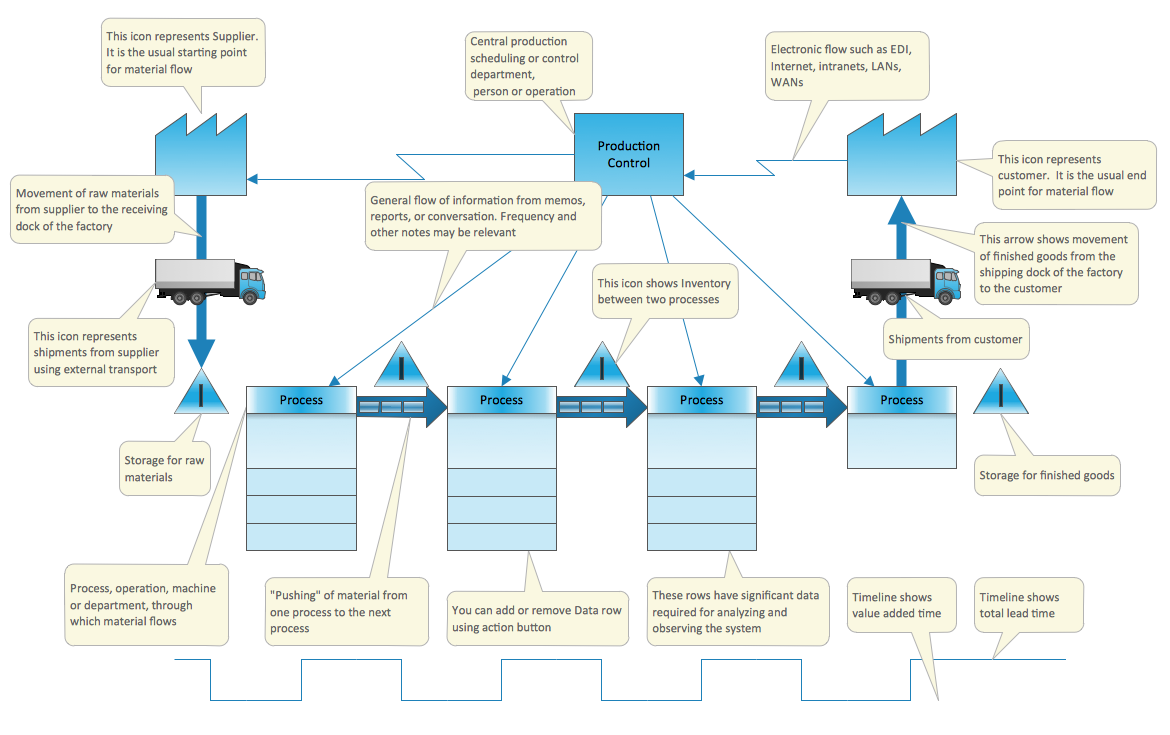
Pic.1 Value stream map (VSM) template.
This template of Value Stream Map is contained in the Value Stream Mapping solution located in the ConceptDraw Solution Park. It helps you to draw VSM diagrams using ConceptDraw DIAGRAM easy and quick.
This Value Stream Map template explains the meanings of the VSM design elements.
See also Samples:
FOUR RELATED HOW TO's:
Create value stream maps - for value stream analysis and value stream management, material and information flow mapping, using our quick start templates included with ConceptDraw.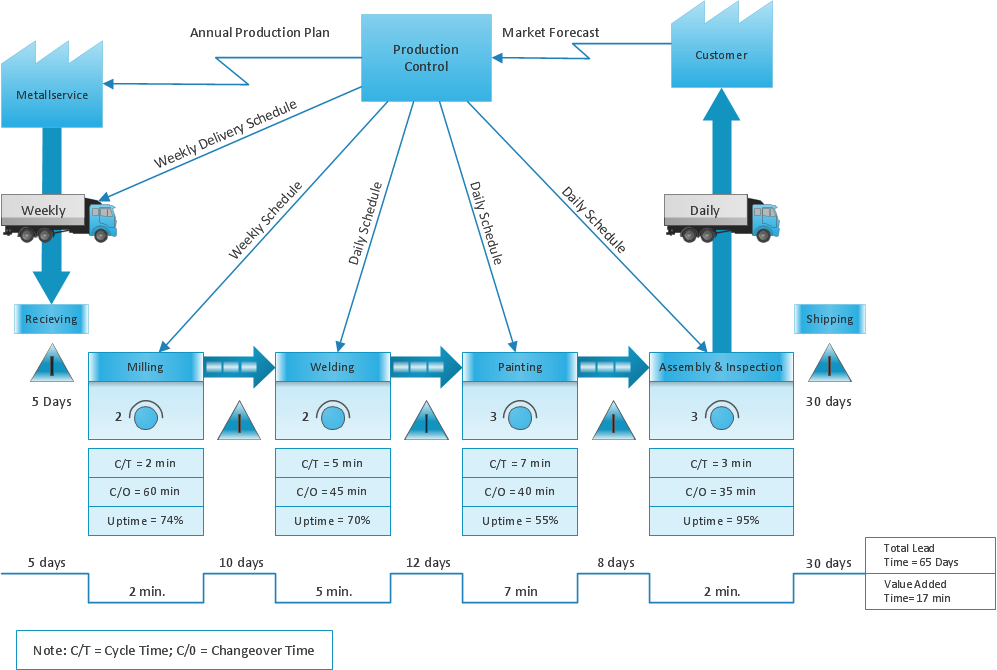
Picture: The Lean Enterprise Value Stream Mapping
Related Solution:
ConceptDraw Value Stream Maps visualize for a manufacturing plant the material and information flow required to deliver a product/service to customers.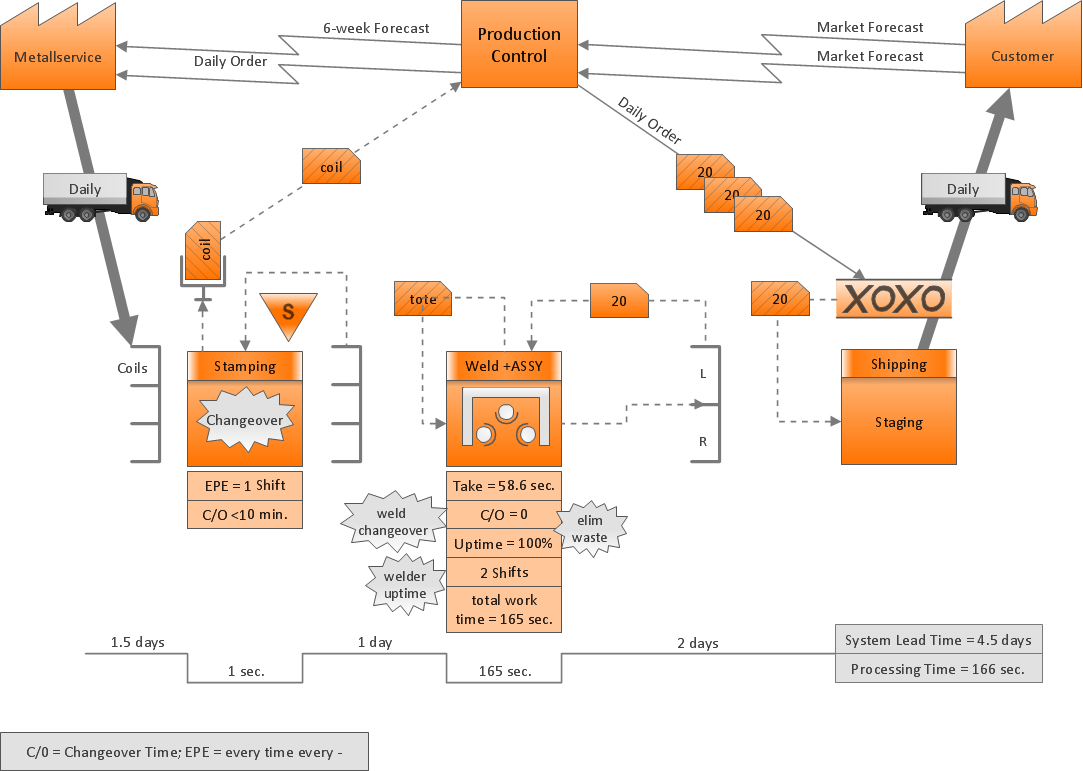
Picture: Purposes of a Value Stream Management Tool
Related Solution:
Subway infographic design elements for ConceptDraw DIAGRAM (mac and pc).
Picture: Infographic design elements, software toolsSubway and Metro style
Related Solution:
ConceptDraw MINDMAP is a fundamental tool in quality management to describe visual instructions on any process.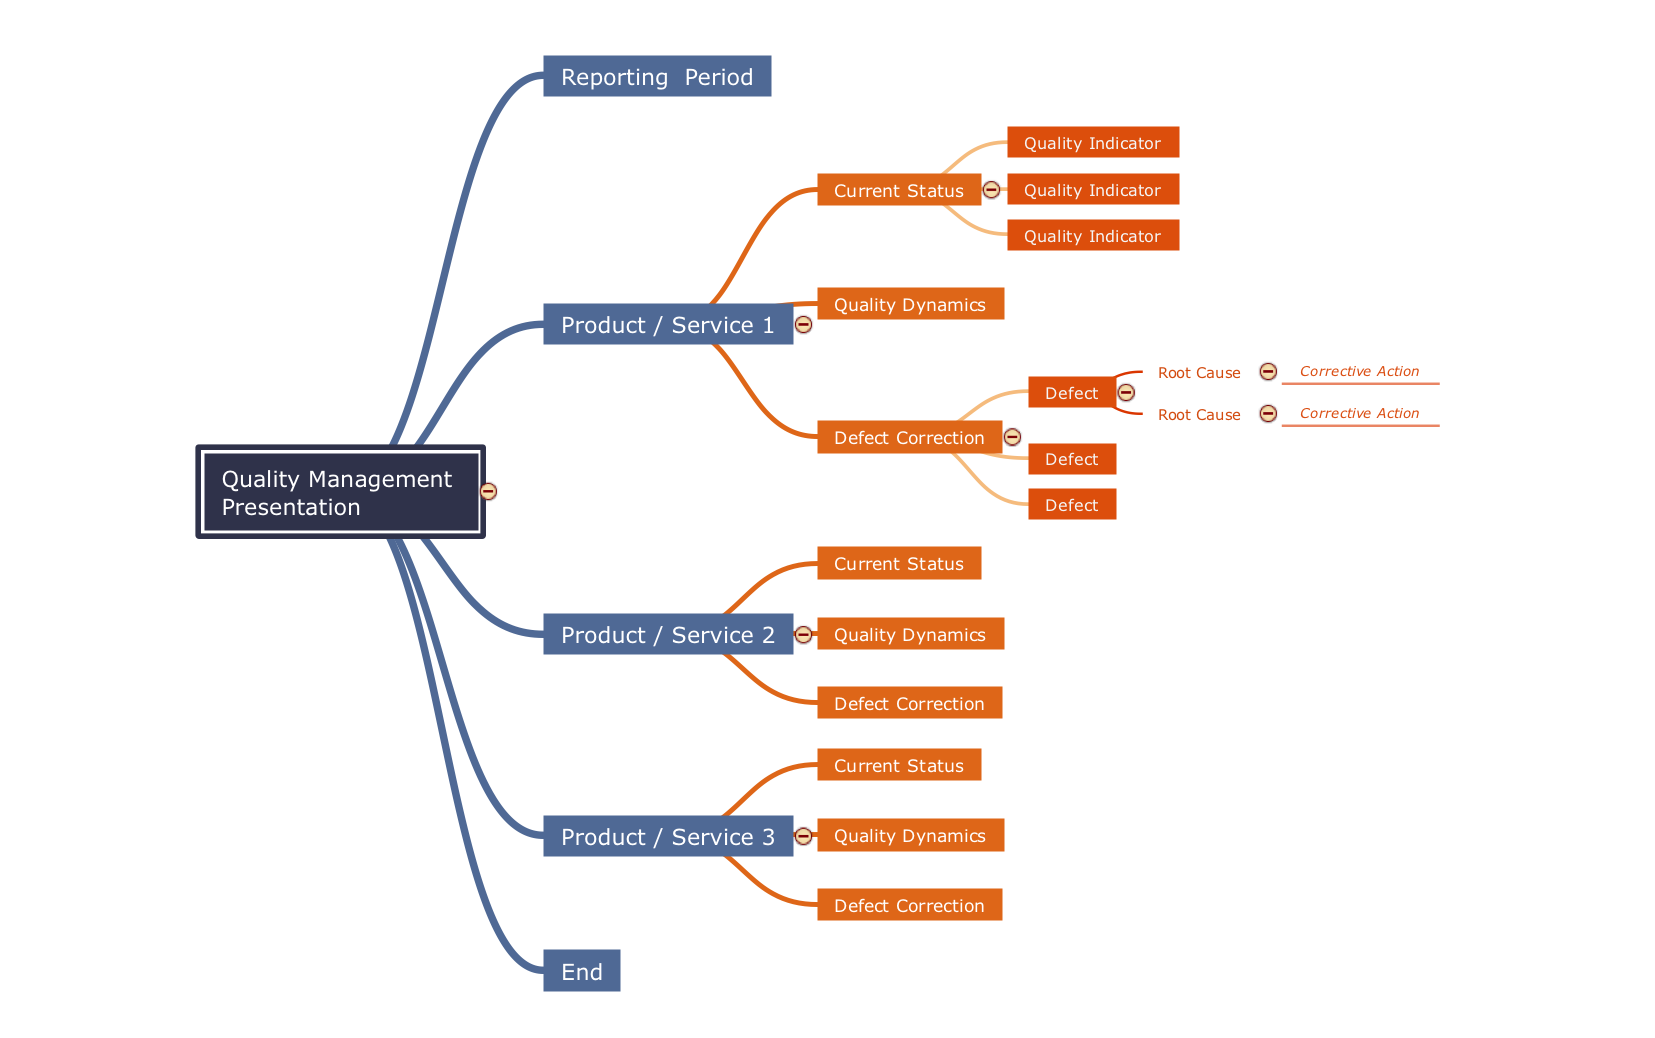
Picture: Fundamental Tool in Quality Management
Related Solution:
ConceptDraw
MINDMAP 16