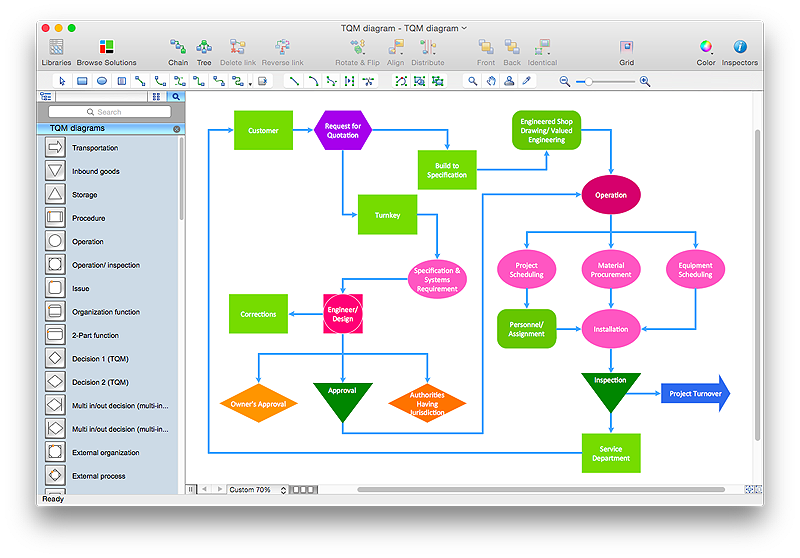
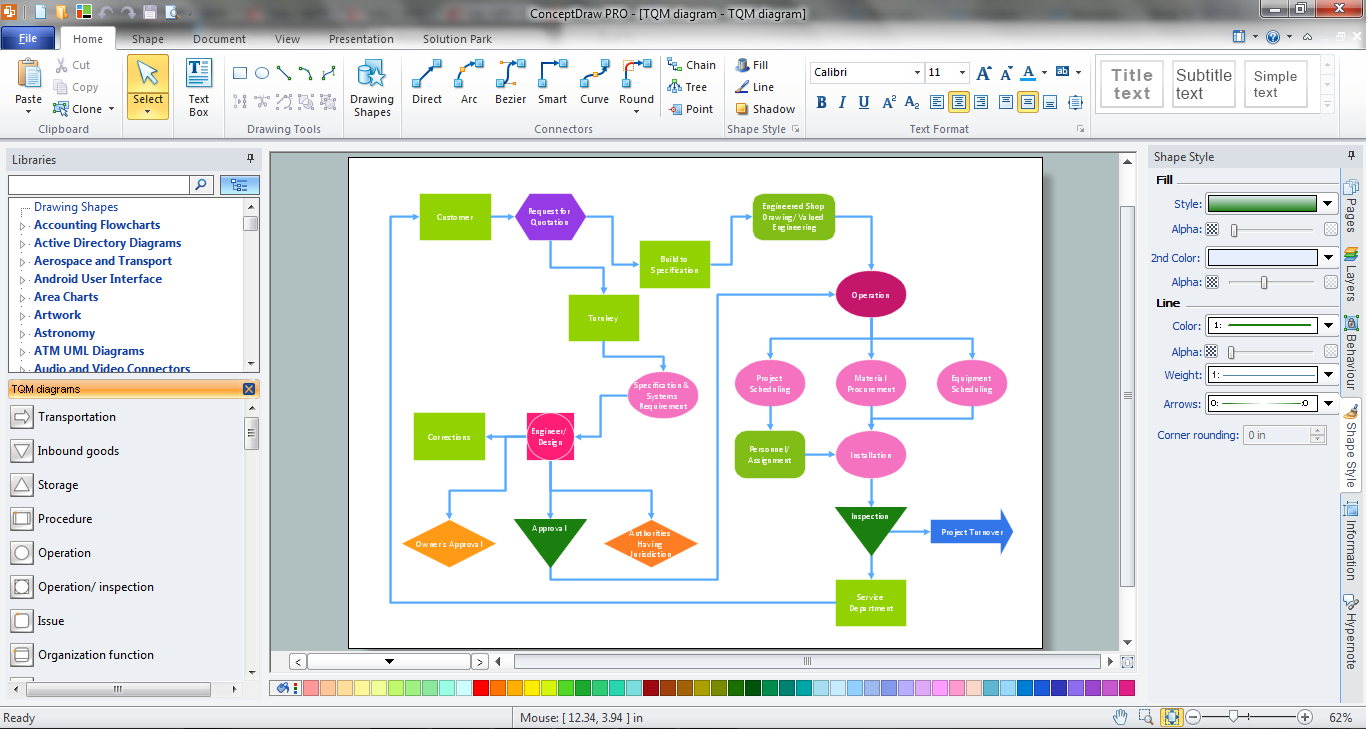
TQM Diagram Tool
The Total Quality Management Diagram solution helps you and your organization visualize business and industrial processes. Create Total Quality Management diagrams for business process with ConceptDraw software.
 Total Quality Management TQM Diagrams
Total Quality Management Diagrams solution extends ConceptDraw PRO software with samples, templates and vector stencils library for drawing the TQM flowcharts.
 Seven Basic Tools of Quality
Manage quality control in the workplace, using fishbone diagrams, flowcharts, Pareto charts and histograms, provided by the Seven Basic Tools of Quality solution.
TQM Tools
ConceptDraw PRO diagramming and vector drawing software enhanced with Total Quality Management (TQM) Diagrams solution from the Quality area of ConceptDraw Solution Park is rich for the useful and effective TQM tools.Quality Management Tools
ConceptDraw PRO diagramming and vector drawing software offers at your disposal quality management tools of the Total Quality Management (TQM) Diagrams solution from the Quality area of ConceptDraw Solution Park which will help facilitate a drawing diagrams process for quality management.TQM Software — Build Professional TQM Diagrams
The Total Quality Management Diagram solution helps you and your organization visualize business and industrial processes. Create Total Quality Management diagrams for business process with ConceptDraw software.TQM Diagram — Professional Total Quality Management
The Total Quality Management Diagram solution helps you and your organization visualize business and industrial processes. Create Total Quality Management diagrams for business process with ConceptDraw software.
 ConceptDraw Solution Park
ConceptDraw Solution Park collects graphic extensions, examples and learning materials
TQM Diagram Example
The Total Quality Management Diagram solution helps you and your organization visualize business and industrial processes. Create Total Quality Management diagrams for business process with ConceptDraw software.HelpDesk
How to Create a TQM Diagram Using Total Quality Management Solution
TQM diagrams, created with ConceptDraw tools can be used for developing improvement plans and quality solutions in a bushiness organization.TQM Software
ConceptDraw PRO diagramming and vector drawing software extended with Total Quality Management (TQM) Diagrams solution from the Quality area of ConceptDraw Solution Park is a powerful TQM software.Total Quality Management
ConceptDraw PRO diagramming and vector drawing software extended with Total Quality Management (TQM) Diagrams solution from the Quality area of ConceptDraw Solution Park is effective software for Total Quality Management.Management Tools — Total Quality Management
The Total Quality Management Diagram solution helps your organization visualize business and industrial processes. Create Total Quality Management diagrams for business process with ConceptDraw software.Quality Management System
ConceptDraw PRO diagramming and vector drawing software extended with Total Quality Management (TQM) Diagrams solution from the Quality area of ConceptDraw Solution Park perfectly suits for development and visually representing a Quality Management System.
 Quality Mind Map
This solution extends ConceptDraw MINDMAP software with Quality Management Mind Maps (Presentations, Meeting Agendas, Problem to be solved).
Total Quality Management with ConceptDraw
Total Quality Management (TQM) system is the management method where the confidence in quality of all organization processes is placed foremost. The given method is widely used in production, in educational system, in government organizations and so on.
 Seven Management and Planning Tools
Seven Management and Planning Tools solution extends ConceptDraw PRO and ConceptDraw MINDMAP with features, templates, samples and libraries of vector stencils for drawing management mind maps and diagrams.
Value Stream Mapping Symbols
VSM symbols are the best for a production process designing. The entire Value Stream Mapping method uses a graphical representation of the manufacturing process, factors' pros and cons, that all stakeholders can easily understand. Value Stream Mapping is a graphical technique that provides possibilities to improve analysis of a manufacturing process, at the stage of the transferring information or materials that required to deliver a product or service to the customer.- Seven Management and Planning Tools | Total Quality Management ...
- Seven Management and Planning Tools | TQM Diagram Tool ...
- Seven Management and Planning Tools | TQM Diagram Example ...
- Constant improvement of key performance indicators | TQM Diagram ...
- TQM Diagram Example | Seven Management and Planning Tools ...
- Quality fishbone diagram - Template | Cause and Effect Diagrams ...
- Total Quality Management TQM Diagrams | Seven Management and ...
- Seven Management and Planning Tools | Flowchart Process ...
- Seven Management and Planning Tools | Business Productivity ...
- Seven Management and Planning Tools | Total Quality Management ...
- Seven Management and Planning Tools | Affinity diagram template ...
- Seven Management and Planning Tools | Types of Flowchart ...
- Total Quality Management TQM Diagrams | Fishbone Diagram ...
- Probability Quality Control Tools | TQM Diagram Tool | TQM Diagram
- Seven Management and Planning Tools | Total Quality Management ...
- Seven Management and Planning Tools | TQM Diagram ...
- Management Tools — Total Quality Management | Seven ...
- Total Quality Management Value
- PROBLEM ANALYSIS Root Cause Analysis Tree Diagram | Total ...
- Quality Engineering Diagrams | Seven Management and Planning ...


-Diagram-in-SolutionBrowser.png)


