Constant improvement of key performance indicators

TQM Diagram — Professional Total Quality Management

 PM Dashboards
The PM Dashboards solution extends the management boundaries of ConceptDraw DIAGRAM and ConceptDraw PROJECT products with an ability to demonstrate changes to the budget status, to show the project progress toward its objectives, to display clearly the identified key performance indicator (KPI) or the set of key performance indicators for any project. This solution provides you with examples and ability to generate three types of visual dashboards reports based on your project data Project Dashboard, Tactical Dashboard, and Radar Chart. By dynamically charting the project’s key performance indicators that are collected on one ConceptDraw DIAGRAM document page, all project participants, project managers, team members, team leaders, stakeholders, and the entire organizations, for which this solution is intended, have access to the daily status of projects they are involved in.
Performance Indicators

 Business Intelligence Dashboard
Business Intelligence Dashboard solution extends the ConceptDraw DIAGRAM functionality with exclusive tools, numerous ready-to-use vector objects, samples and quick-start templates for creation professional Business Intelligence Dashboards, Business Intelligence Graphics, Business Intelligence Charts and Maps of different kinds. Design easy the BI dashboard, BI model or Dynamic chart in ConceptDraw DIAGRAM to monitor the company's work, to track the indicators corresponding your company's data, to display and analyze key performance indicators, to evaluate the trends and regularities of the processes occurring at the company.
 HR Dashboard
The HR Dashboard solution extends ConceptDraw DIAGRAM functionality with powerful drawing tools and great collection of comprehensive vector design elements, icons, pictograms and objects, navigation elements, live objects of HR charts, HR indicators, and thematic maps. The range of HR Dashboards applications is extensive, among them the human resource management, recruitment, hiring process, human resource development. ConceptDraw DIAGRAM software is perfect for creation HR Dashboard with any goal you need. It gives you all opportunities for designing not only informative, but also professional looking and attractive HR Dashboards of any style and degree of detalization, that are perfect for using in presentations, reports and other thematic documents.
PROBLEM ANALYSIS. Relations Diagram


 Logistic Dashboard
The powerful tools of Logistic Dashboard solution and specially developed live graphic objects of logistic icons, logistic navigation elements, logistic indicators, logistic charts and logistic maps effectively assist in designing Logistic dashboards, Logistic maps, Logistic charts, diagrams and infographics. The included set of prebuilt samples and quick-start templates, demonstrates the power of ConceptDraw DIAGRAM software in logistics management, its assisting abilities in development, realization and analyzing the logistic processes, as well as in perfection the methods of logistics management.
HelpDesk
How To Create the Interaction (Relations) Diagram
 Diagram")
 Meter Dashboard
Meter dashboard solution extends ConceptDraw DIAGRAM software with templates, samples and vector stencils library with meter indicators for drawing visual dashboards showing quantitative data.
Quality Control

Relations Diagram

 Status Dashboard
Status dashboard solution extends ConceptDraw DIAGRAM software with templates, samples and vector stencils libraries with graphic indicators for drawing the visual dashboards showing status data.
What is a KPI?

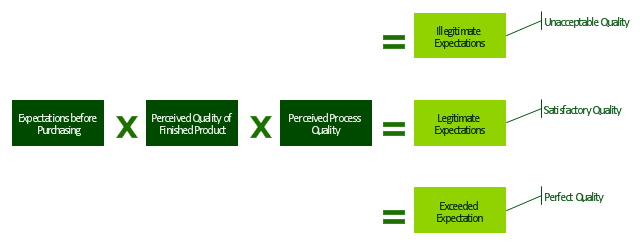
"Customer satisfaction is a term frequently used in marketing. It is a measure of how products and services supplied by a company meet or surpass customer expectation. Customer satisfaction is defined as "the number of customers, or percentage of total customers, whose reported experience with a firm, its products, or its services (ratings) exceeds specified satisfaction goals." ...
It is seen as a key performance indicator within business and is often part of a Balanced Scorecard. In a competitive marketplace where businesses compete for customers, customer satisfaction is seen as a key differentiator and increasingly has become a key element of business strategy." [Customer satisfaction. Wikipedia]
The block diagram example "Sources of customer satisfaction" was created using the ConceptDraw PRO diagramming and vector drawing software extended with the Block Diagrams solution from the area "What is a Diagram" of ConceptDraw Solution Park.
Block diagram
 Business Diagrams
The Business Diagrams Solution extends ConceptDraw DIAGRAM with an extensive collection of professionally designed illustrative samples and a wide variety of vector stencils libraries, which are the real help for all business-related people, business analysts, business managers, business advisers, marketing experts, PR managers, knowledge workers, scientists, and other stakeholders allowing them to design the bright, neat, expressive and attractive Bubble Diagrams, Circle-Spoke Diagrams, Circular Arrows Diagrams, and Venn Diagrams with different quantity of sets in just minutes; and then successfully use them in documents, reports, statistical summaries, and presentations of any style.
KPI Dashboard

Dashboard

- Constant improvement of key performance indicators | Performance ...
- Constant improvement of key performance indicators
- Performance Indicators | Dashboard | Logistic Dashboard | Key ...
- Performance Indicators | KPI Dashboard | PM Dashboards | Key ...
- KPI Dashboard | Performance Indicators | Sales Dashboard | Key ...
- Key Performance Indicators Icon
- Performance Indicators | Design elements - Sales KPIs and metrics ...
- Performance Indicators | Logistic Dashboard | HR Dashboard | Key ...
- Organizational Structure Total Quality Management | Constant ...
- Performance Indicators | KPI Dashboard | What is a KPI? | Key ...
- Design elements - Composition charts and indicators | Performance ...
- Constant improvement of key performance indicators | Key ...
- Performance Indicators | KPI Dashboard | Constant improvement of ...
- Constant improvement of key performance indicators | Quality Mind ...
- KPI Dashboard | KPIs and Metrics | Business Graphics Software ...
- Performance Indicators | Sales Performance | Constant improvement ...
- KPI Dashboard | Basic Flowchart Symbols and Meaning ...
- Performance Indicators | Constant improvement of key performance ...
- Performance Indicators | TQM Diagram — Professional Total Quality ...
- Performance Indicators | Block diagram - Stages of promise issue ...