Performance Indicators

"Service quality is a comparison of expectations with performance.
A business with high service quality will meet customer needs whilst remaining economically competitive. Improved service quality may increase economic competitiveness.
This aim may be achieved by understanding and improving operational processes; identifying problems quickly and systematically; establishing valid and reliable service performance measures and measuring customer satisfaction and other performance outcomes." [Service quality. Wikipedia]
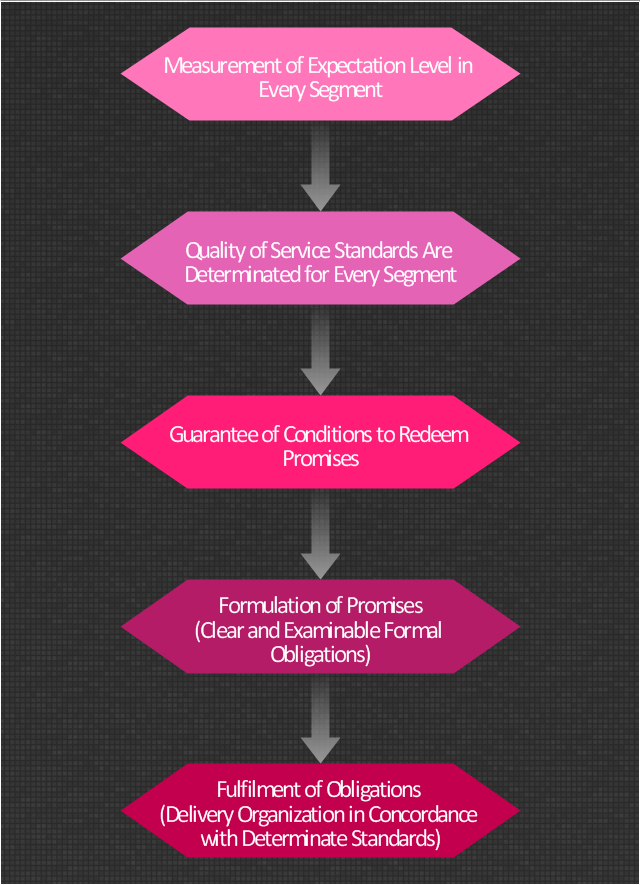
The block diagram example "Stages of promise issue" was created using the ConceptDraw PRO diagramming and vector drawing software extended with the Block Diagrams solution from the area "What is a Diagram" of ConceptDraw Solution Park.
A business with high service quality will meet customer needs whilst remaining economically competitive. Improved service quality may increase economic competitiveness.
This aim may be achieved by understanding and improving operational processes; identifying problems quickly and systematically; establishing valid and reliable service performance measures and measuring customer satisfaction and other performance outcomes." [Service quality. Wikipedia]
The block diagram example "Stages of promise issue" was created using the ConceptDraw PRO diagramming and vector drawing software extended with the Block Diagrams solution from the area "What is a Diagram" of ConceptDraw Solution Park.
Block diagram
BPR Diagram. Business Process Reengineering Example

What is a KPI?

Sales Teams are Inherently Competitive
Constant improvement of key performance indicators

Customer Relationship Management

A KPI Dashboard Provides the Answers Your Sales Team

The Facts and KPIs

 Meter Dashboard
Meter dashboard solution extends ConceptDraw PRO software with templates, samples and vector stencils library with meter indicators for drawing visual dashboards showing quantitative data.
Pyramid Chart Examples

Strategy Map

Process Flowchart


SWOT Analysis

- Block diagram - Sources of customer satisfaction | Marketing ...
- Marketing Campaign Performance Dashboard Examples
- Cafe performance metrics vs. air temperature - Visual dashboard ...
- Block diagram - Stages of promise issue
- Sales Growth. Bar Graphs Example | Sales Dashboards for Your ...
- BPR Diagram. Business Process Reengineering Example | Meter ...
- Performance Indicators Examples
- KPIs and Metrics | Visualize Sales Data Using Sample Data | Sales ...
- Human Resource Dashboard Example
- Block diagram - Sources of customer satisfaction | Quality ...
- Performance Indicators | Sales Dashboard Examples | Sales ...
- Block diagram - Stages of promise issue | Block Diagrams | AWS ...
- Pie Chart Of Customer Satisfaction
- Pie Chart Customer Satisfaction
- KPIs and Metrics | Business Intelligence Dashboard | The Facts and ...
- Performance Indicators | PM Dashboards | Design elements - Sales ...
- Performance Indicators | Design elements - Sales KPIs and metrics ...
- Key Performance Indicators Dashboard Examples
- Flow chart Example . Warehouse Flowchart | Stakeholder Onion ...