"Web analytics is the measurement, collection, analysis and reporting of internet data for purposes of understanding and optimizing web usage.
Web analytics is not just a tool for measuring web traffic but can be used as a tool for business and market research, and to assess and improve the effectiveness of a web site. Web analytics applications can also help companies measure the results of traditional print or broadcast advertising campaigns. It helps one to estimate how traffic to a website changes after the launch of a new advertising campaign. Web analytics provides information about the number of visitors to a website and the number of page views. It helps gauge traffic and popularity trends which is useful for market research.
There are two categories of web analytics; off-site and on-site web analytics.
Off-site web analytics refers to web measurement and analysis regardless of whether you own or maintain a website.
On-site web analytics measure a visitor's behavior once on your website. This includes its drivers and conversions; for example, the degree to which different landing pages are associated with online purchases. On-site web analytics measures the performance of your website in a commercial context. This data is typically compared against key performance indicators for performance, and used to improve a web site or marketing campaign's audience response." [Web analytics. Wikipedia]
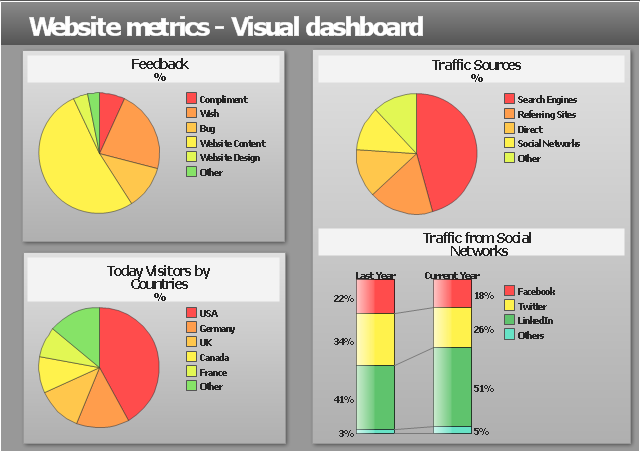
The example "Website metrics - Visual dashboard" was created using the ConceptDraw PRO diagramming and vector drawing software extended with the Composition Dashboard solution from the area "What is a Dashboard" of ConceptDraw Solution Park.
Web analytics is not just a tool for measuring web traffic but can be used as a tool for business and market research, and to assess and improve the effectiveness of a web site. Web analytics applications can also help companies measure the results of traditional print or broadcast advertising campaigns. It helps one to estimate how traffic to a website changes after the launch of a new advertising campaign. Web analytics provides information about the number of visitors to a website and the number of page views. It helps gauge traffic and popularity trends which is useful for market research.
There are two categories of web analytics; off-site and on-site web analytics.
Off-site web analytics refers to web measurement and analysis regardless of whether you own or maintain a website.
On-site web analytics measure a visitor's behavior once on your website. This includes its drivers and conversions; for example, the degree to which different landing pages are associated with online purchases. On-site web analytics measures the performance of your website in a commercial context. This data is typically compared against key performance indicators for performance, and used to improve a web site or marketing campaign's audience response." [Web analytics. Wikipedia]
The example "Website metrics - Visual dashboard" was created using the ConceptDraw PRO diagramming and vector drawing software extended with the Composition Dashboard solution from the area "What is a Dashboard" of ConceptDraw Solution Park.
Visual dashboard
 Marketing Diagrams
Marketing Diagrams solution extends ConceptDraw DIAGRAM diagramming software with abundance of samples, templates and vector design elements intended for easy graphical visualization and drawing different types of Marketing diagrams and graphs, including Branding Strategies Diagram, Five Forces Model Diagram, Decision Tree Diagram, Puzzle Diagram, Step Diagram, Process Chart, Strategy Map, Funnel Diagram, Value Chain Diagram, Ladder of Customer Loyalty Diagram, Leaky Bucket Diagram, Promotional Mix Diagram, Service-Goods Continuum Diagram, Six Markets Model Diagram, Sources of Customer Satisfaction Diagram, etc. Analyze effectively the marketing activity of your company and apply the optimal marketing methods with ConceptDraw DIAGRAM software.
SWOT Analysis

 Business Process Diagrams
Business Process Diagrams solution extends the ConceptDraw DIAGRAM BPM software with RapidDraw interface, templates, samples and numerous libraries based on the BPMN 1.2 and BPMN 2.0 standards, which give you the possibility to visualize equally easy simple and complex processes, to design business models, to quickly develop and document in details any business processes on the stages of project’s planning and implementation.
 Funnel Diagrams
Funnel Diagrams solution including wide range of funnel diagram samples, sales funnel examples, and vector design elements, makes the ConceptDraw DIAGRAM ideal for funnel management and creation the Funnel Diagrams of different types and designs, AIDA Model, AIDAS, ACCA Dagmar, Rossiter-Percy Model, Sales funnel, Marketing funnel, Search funnel, Brand funnel, Purchase funnel, Lead funnel, Conversion funnel, Business funnel, etc. You are free to choose to place your funnel object horizontally or vertically, you can use the objects with desired quantity of sales funnel stages, as well as to modify their size, color filling, and other parameters to make exceptionally looking Funnel diagrams fully responding to your desires.
 PM Dashboards
The PM Dashboards solution extends the management boundaries of ConceptDraw DIAGRAM and ConceptDraw PROJECT products with an ability to demonstrate changes to the budget status, to show the project progress toward its objectives, to display clearly the identified key performance indicator (KPI) or the set of key performance indicators for any project. This solution provides you with examples and ability to generate three types of visual dashboards reports based on your project data Project Dashboard, Tactical Dashboard, and Radar Chart. By dynamically charting the project’s key performance indicators that are collected on one ConceptDraw DIAGRAM document page, all project participants, project managers, team members, team leaders, stakeholders, and the entire organizations, for which this solution is intended, have access to the daily status of projects they are involved in.
 ConceptDraw Dashboard for Facebook
ConceptDraw Dashboard for Facebook solution extends ConceptDraw DIAGRAM software with a dynamically updated visual dashboard, which shows lifetime total likes, daily friends of fans, and daily page views, information you can receive from Facebook Insights.
SWOT analysis matrix diagram templates

TOWS Matrix

- Customer Service Performance Measures Examples
- Website traffic dashboard | Website metrics - Visual dashboard ...
- Metrics Website
- Concept Draw Metrics
- Cafe performance metrics vs. air temperature - Visual dashboard ...
- A KPI Dashboard | Sales Dashboards for Your Company | Ways You ...
- How To Create an HR Metric Dashboard | KPIs and Metrics | HR ...
- Website traffic dashboard | Website KPIs - Visual dashboard ...
- Website Wireframe | How to Develop Website Wireframes Using ...
- AWS Analytics - Vector stencils library | Design elements - AWS ...