HelpDesk
How To Create an HR Metric Dashboard
KPIs and Metrics

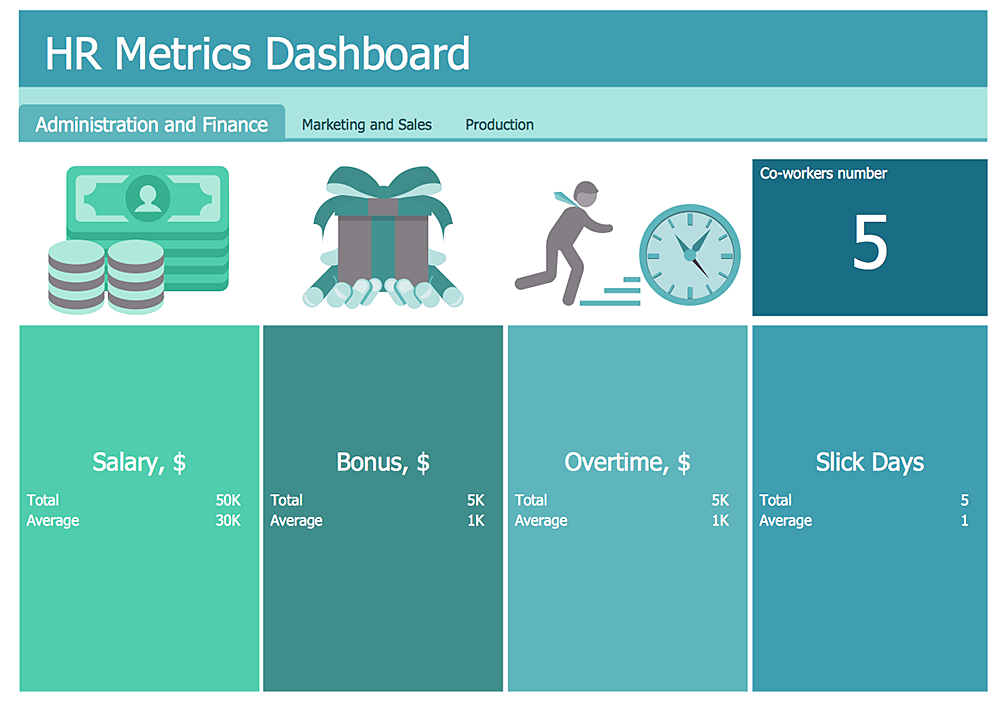
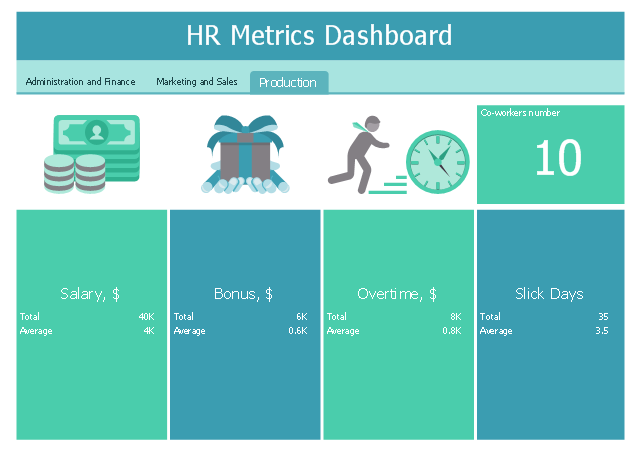
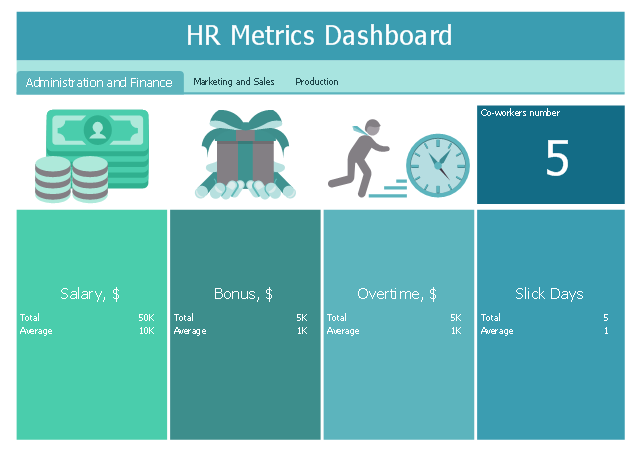
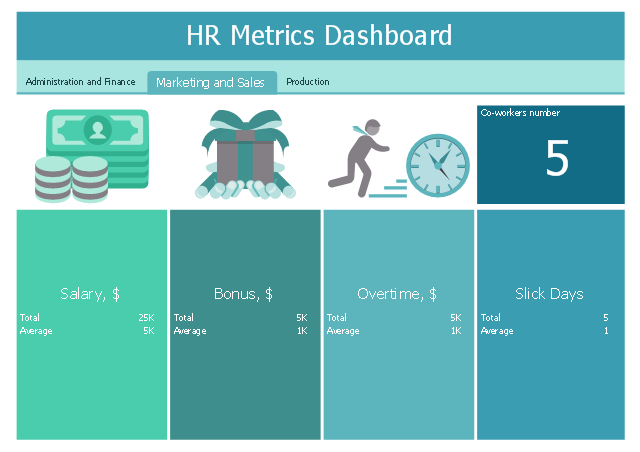
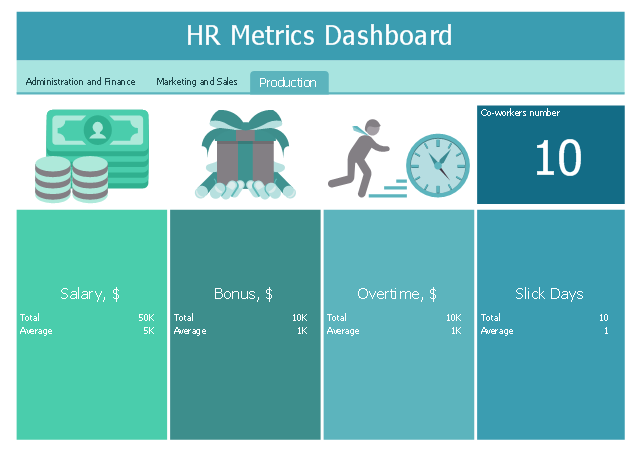
This performance dashboard sample shows HR metrics by departments: co-workrers number, salary, bonus, overtime, slick days.
"Human Resource (HR) metrics are measurements used to determine the value and effectiveness of HR initiatives, typically including such areas as turnover, training, return on human capital, costs of labor, and expenses per employee." [HR Metric. Wikipedia]
The human resources dashboard example "HR Metrics Dashboard" was designed using ConceptDraw PRO software extended with HR Dashboard solution from Management area of ConceptDraw Solution Park.
Administration and Finance
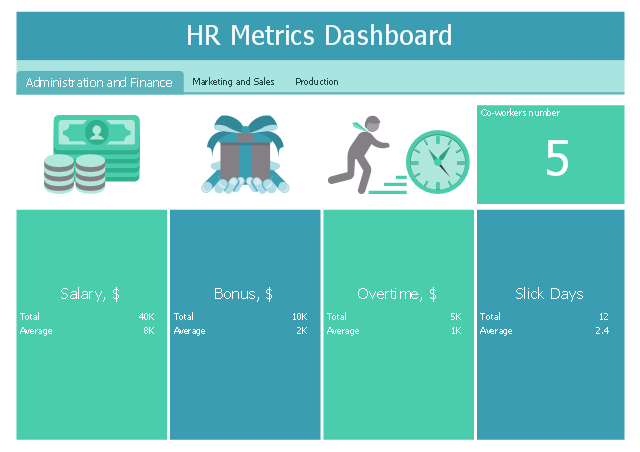
Marketing and Sales
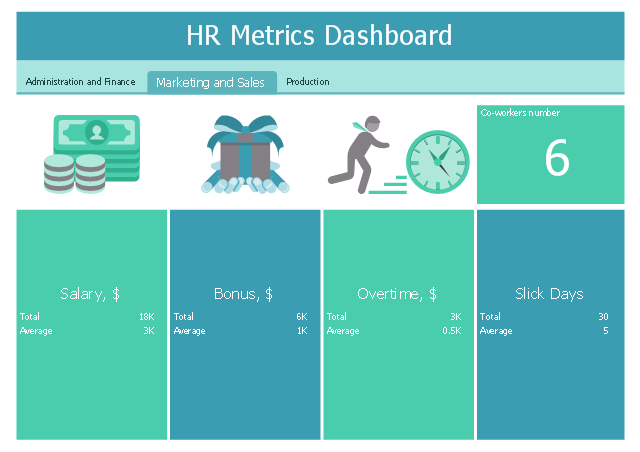
Production
 HR Dashboard
The HR Dashboard solution extends ConceptDraw DIAGRAM functionality with powerful drawing tools and great collection of comprehensive vector design elements, icons, pictograms and objects, navigation elements, live objects of HR charts, HR indicators, and thematic maps. The range of HR Dashboards applications is extensive, among them the human resource management, recruitment, hiring process, human resource development. ConceptDraw DIAGRAM software is perfect for creation HR Dashboard with any goal you need. It gives you all opportunities for designing not only informative, but also professional looking and attractive HR Dashboards of any style and degree of detalization, that are perfect for using in presentations, reports and other thematic documents.
A KPI Dashboard Provides the Answers Your Sales Team

This HR dashboard template for ConceptDraw PRO software consits of single digital value indicator, multi digital values indicators, tab set and icons.
To set data source files for graphic indicators use Action menu.
The human resources dashboard template "HR Metrics Dashboard" is included in HR Dashboard solution from Management area of ConceptDraw Solution Park.
To set data source files for graphic indicators use Action menu.
The human resources dashboard template "HR Metrics Dashboard" is included in HR Dashboard solution from Management area of ConceptDraw Solution Park.
Administration and Finance
Marketing and Sales
Production
KPI Dashboard

This sale dashboard example contains KPIs and sales effectiveness metrics visual indicators: speedometer gauge, dial, slider, level meter and bullet indicators.
"Sales effectiveness refers to the ability of a company’s sales professionals to “win” at each stage of the customer’s buying process, and ultimately earn the business on the right terms and in the right timeframe.
Improving sales effectiveness is not just a sales function issue; it’s a company issue, as it requires deep collaboration between sales and marketing to understand what’s working and not working, and continuous improvement of the knowledge, messages, skills, and strategies that sales people apply as they work sales opportunities.
Sales effectiveness has historically been used to describe a category of technologies and consulting services aimed at helping companies improve their sales results.
Many companies are creating sales effectiveness functions and have even given people titles such as VP of Sales Effectiveness." [Sales effectiveness. Wikipedia]
The example "Sales metrics and KPIs" was created using the ConceptDraw PRO diagramming and vector drawing software extended with the Meter Dashboard solution from the area "What is a Dashboard" of ConceptDraw Solution Park.
Sales dashboard

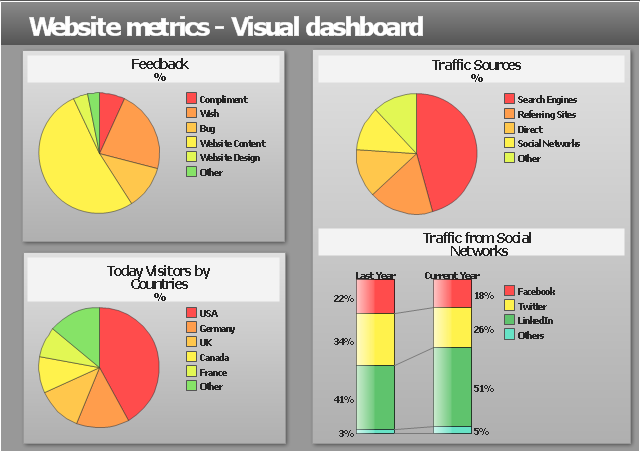
"Web analytics is the measurement, collection, analysis and reporting of internet data for purposes of understanding and optimizing web usage.
Web analytics is not just a tool for measuring web traffic but can be used as a tool for business and market research, and to assess and improve the effectiveness of a web site. Web analytics applications can also help companies measure the results of traditional print or broadcast advertising campaigns. It helps one to estimate how traffic to a website changes after the launch of a new advertising campaign. Web analytics provides information about the number of visitors to a website and the number of page views. It helps gauge traffic and popularity trends which is useful for market research.
There are two categories of web analytics; off-site and on-site web analytics.
Off-site web analytics refers to web measurement and analysis regardless of whether you own or maintain a website.
On-site web analytics measure a visitor's behavior once on your website. This includes its drivers and conversions; for example, the degree to which different landing pages are associated with online purchases. On-site web analytics measures the performance of your website in a commercial context. This data is typically compared against key performance indicators for performance, and used to improve a web site or marketing campaign's audience response." [Web analytics. Wikipedia]
The example "Website metrics - Visual dashboard" was created using the ConceptDraw PRO diagramming and vector drawing software extended with the Composition Dashboard solution from the area "What is a Dashboard" of ConceptDraw Solution Park.
Visual dashboard
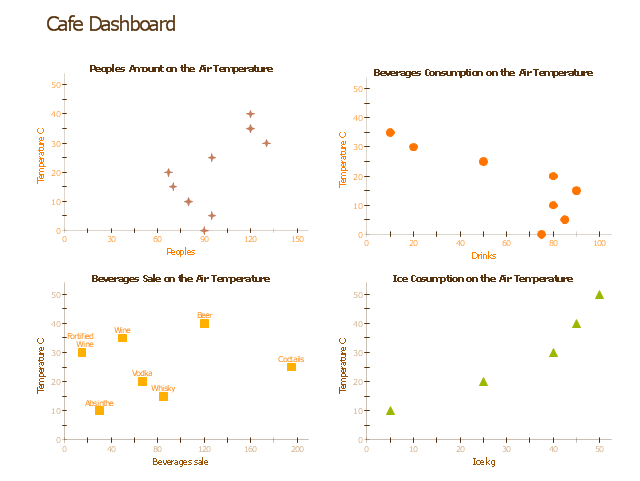
"A performance metric is that which determines an organization's behavior and performance. Performance metrics measure of an organization's activities and performance. It should support a range of stakeholder needs from customers, shareholders to employees. While traditionally many metrics are finance based, inwardly focusing on the performance of the organization, metrics may also focus on the performance against customer requirements and value. In project management, performance metrics are used to assess the health of the project and consist of the measuring of seven criteria: safety, time, cost, resources, scope, quality, and actions. Developing performance metrics usually follows a process of: 1. Establishing critical processes/ customer requirements. 2. Identifying specific, quantifiable outputs of work. 3. Establishing targets against which results can be scored." [Performance metric. Wikipedia] The example "Cafe performance metrics vs. air temperature - Visual dashboard" was created using the ConceptDraw PRO diagramming and vector drawing software extended with the Corellation Dashboard solution from the area "What is a Dashboard" of ConceptDraw Solution Park.
Visual dashboard
- How To Create an HR Metric Dashboard | KPIs and Metrics ...
- Sales Dashboard Template | KPIs and Metrics | Sales Dashboard ...
- KPIs and Metrics | Business Intelligence Dashboard | The Facts and ...
- Salesforce Metric Dashboard Examples
- KPIs and Metrics | The Facts and KPIs | A KPI Dashboard | After ...
- Information Security Metrics Dashboard Examples
- HR Metrics Dashboard | HR Dashboard | Enterprise dashboard | Hr ...
- Sales metrics and KPIs - Visual dashboard | Sales KPIs ...
- The Facts and KPIs | Logistics KPI Dashboard - Template | A KPI ...
- Logistic Dashboard | 25 Typical Orgcharts | ConceptDraw ...