The vector stencils library "AWS Analytics" contains 9 Amazon Web Services analytics icons: Amazon EMR, Cluster, MapR M3 engine, MapR M5 engine, MapR M7 engine, Engine, Amazon Kinesis, Kinesis-enabled app, AWS Data Pipeline. Use it to draw AWS architecture diagrams of cloud service. AWS analytics services include: Hadoop, Real-time, Machine Learning, Data Warehouse, Data Pipelines. The symbols example "AWS Analytics - Vector stencils library" was created using the ConceptDraw PRO diagramming and vector drawing software extended with the AWS Architecture Diagrams solution from the Computer and Networks area of ConceptDraw Solution Park.
The vector stencils library "AWS Analytics" contains 9 Amazon Web Services analytics icons: Amazon Elastic MapReduce, Amazon Kinesis, AWS Data Pipeline.
Use it to draw AWS architecture diagrams.
The AWS icons example "Design elements - AWS Analytics" was created using the ConceptDraw PRO diagramming and vector drawing software extended with the AWS Architecture Diagrams solution from the Computer and Networks area of ConceptDraw Solution Park.
Use it to draw AWS architecture diagrams.
The AWS icons example "Design elements - AWS Analytics" was created using the ConceptDraw PRO diagramming and vector drawing software extended with the AWS Architecture Diagrams solution from the Computer and Networks area of ConceptDraw Solution Park.
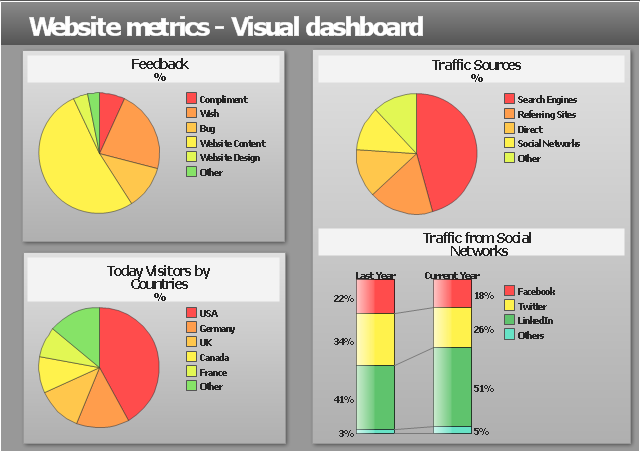
"Web analytics is the measurement, collection, analysis and reporting of internet data for purposes of understanding and optimizing web usage.
Web analytics is not just a tool for measuring web traffic but can be used as a tool for business and market research, and to assess and improve the effectiveness of a web site. Web analytics applications can also help companies measure the results of traditional print or broadcast advertising campaigns. It helps one to estimate how traffic to a website changes after the launch of a new advertising campaign. Web analytics provides information about the number of visitors to a website and the number of page views. It helps gauge traffic and popularity trends which is useful for market research.
There are two categories of web analytics; off-site and on-site web analytics.
Off-site web analytics refers to web measurement and analysis regardless of whether you own or maintain a website.
On-site web analytics measure a visitor's behavior once on your website. This includes its drivers and conversions; for example, the degree to which different landing pages are associated with online purchases. On-site web analytics measures the performance of your website in a commercial context. This data is typically compared against key performance indicators for performance, and used to improve a web site or marketing campaign's audience response." [Web analytics. Wikipedia]
The example "Website metrics - Visual dashboard" was created using the ConceptDraw PRO diagramming and vector drawing software extended with the Composition Dashboard solution from the area "What is a Dashboard" of ConceptDraw Solution Park.
The vector stencils library "AWS Mobile Services" contains 6 Amazon Web Services mobile services icons: Amazon Cognito, Amazon Simple Notification Service, Amazon Mobile Analytics.
Use it to draw Amazon Web Services architecture diagrams.
The AWS icons example "Design elements - AWS Mobile Services" was created using the ConceptDraw PRO diagramming and vector drawing software extended with the AWS Architecture Diagrams solution from the Computer and Networks area of ConceptDraw Solution Park.
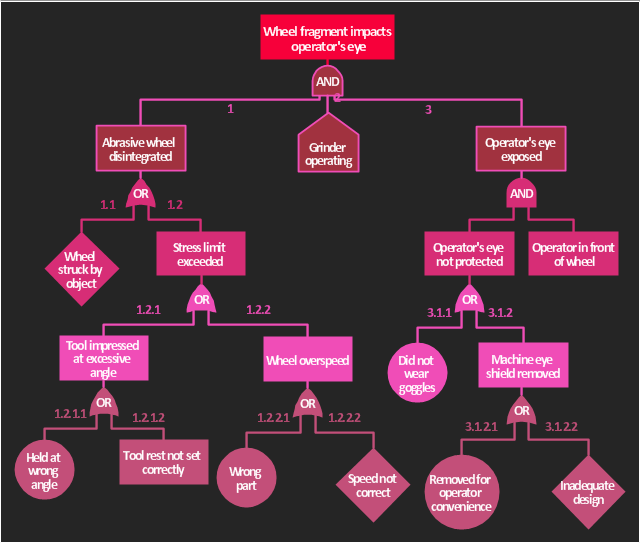
The accident analysis diagram example "Accident analytic tree" was redesigned from the picture 7-14 from the "DOE Workbook. Conducting Accident Investigations. Revision 2."
"Analytic tree analyses are well defined, useful methods that graphically depict, from beginning to end, the events and conditions preceding and immediately following an accident. An analytic tree is a means of organizing information that helps the investigator conduct a deductive analysis of any system (human, equipment, or environmental) to determine critical paths of success and failure. Results from this analysis identify the details and interrelationships that must be considered to prevent the oversights, errors, and omissions that lead to failures. In accident investigations, this type of analysis can consist of both failure paths and success paths, and can lead to neutral, negative, or positive conclusions regarding accident severity.
TIP.
An analytic tree enables the user to:
(1) Systematically identify the possible paths from events to outcome.
(2) Display a graphical record of the analytical process.
(3) Identify management system weaknesses and strengths."
[homer.ornl.gov/ sesa/ corporatesafety/ aip/ docs/ workbook/ Rev2/ chpt7/ chapt7.htm]
The FTA diagram example "Accident analytic tree" was created using the ConceptDraw PRO diagramming and vector drawing software extended with the Fault Tree Analysis Diagrams solution from the Engineering area of ConceptDraw Solution Park.
Spatial Data Analysis
ConceptDraw PRO diagramming and vector drawing software extended with Pictorial Infographics Solution from the “What are Infographics” Area is the best for Spatial Data Analysis. You have a perfect possibility to make sure this right now.The vector stencils library "Web" contains 24 web icons.
Use it to design your WWW and Internet illustrations and infographics with ConceptDraw PRO diagramming and vector drawing software.
The vector stencils library "Web" is included in the Computers and Communications solution from the Illustration area of ConceptDraw Solution Park.
Use it to design your WWW and Internet illustrations and infographics with ConceptDraw PRO diagramming and vector drawing software.
The vector stencils library "Web" is included in the Computers and Communications solution from the Illustration area of ConceptDraw Solution Park.
- AWS Analytics - Vector stencils library | Design elements - AWS ...
- Design elements - AWS Analytics | AWS Analytics - Vector stencils ...
- Decision Tree Analytics
- Sales Analytics | Contoh Flowchart | Process Flowchart | Sales ...
- AWS Analytics - Vector stencils library
- AWS Analytics - Vector stencils library | Cisco products additional ...
- AWS simple icons - Vector stencils library | AWS Analytics - Vector ...
- Design elements - AWS Analytics
- Accident analytic tree - FTA diagram | Fault Tree Analysis Diagrams ...
- Cyber Security Analytics
- Website metrics - Visual dashboard
- Website metrics - Visual dashboard | Website traffic dashboard ...
- Website traffic dashboard | Website metrics - Visual dashboard ...
- Aws Mobile Analytics
- KPIs and Metrics | Cross-functional flowchart Templates portrait ...
- Er Diagram Web Visitor Data Analytics
- Pie Chart Examples and Templates | Business Report Pie. Pie Chart ...
- A KPI Dashboard | Sales Dashboards for Your Company | Ways You ...
- Dfd For Social Media Analytics
- Business Report Pie. Pie Chart Examples | Information Graphics ...

