Sales Analytics
KPI Dashboard

The Facts and KPIs

 Logistic Dashboard
The powerful tools of Logistic Dashboard solution and specially developed live graphic objects of logistic icons, logistic navigation elements, logistic indicators, logistic charts and logistic maps effectively assist in designing Logistic dashboards, Logistic maps, Logistic charts, diagrams and infographics. The included set of prebuilt samples and quick-start templates, demonstrates the power of ConceptDraw PRO software in logistics management, its assisting abilities in development, realization and analyzing the logistic processes, as well as in perfection the methods of logistics management.
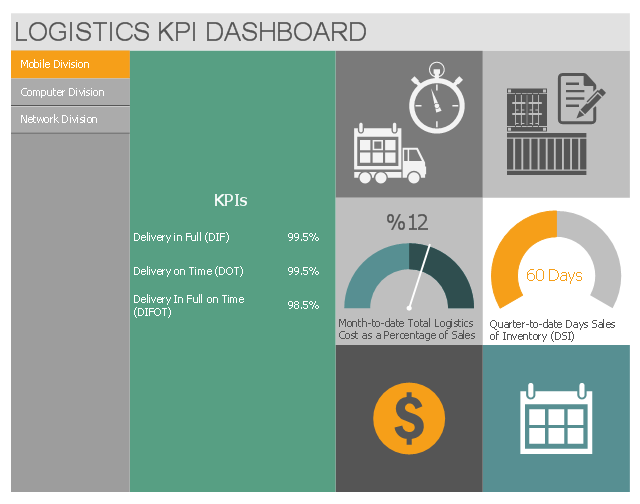
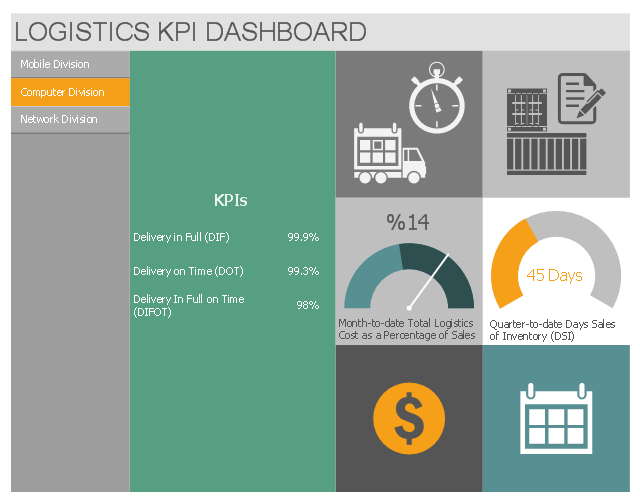
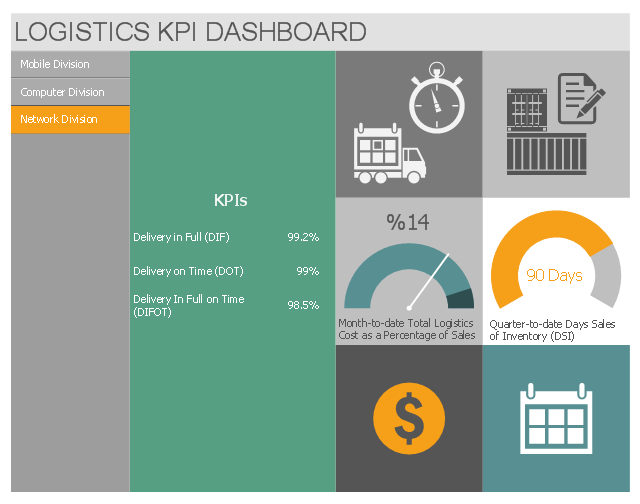
This multipage business dashboard example shows navigation vertical menu and graphic indicators of logistic key performance indicators (KPIs) and business metrics.
"A performance indicator or key performance indicator (KPI) is a type of performance measurement. KPIs evaluate the success of an organization or of a particular activity in which it engages. Often success is simply the repeated, periodic achievement of some levels of operational goal..., and sometimes success is defined in terms of making progress toward strategic goals. Accordingly, choosing the right KPIs relies upon a good understanding of what is important to the organization." [Performance indicator. Wikipedia]
The performance dashboard example "Logistics KPI Dashboard" was designed using ConceptDraw PRO software extended with Logistic Dashboard solution from Business Processes area of ConceptDraw Solution Park.
Mobile Division
Computer Division
Network Division
HelpDesk
How To Create the Interaction (Relation) Diagram
 Diagram sample")
Basic Flowchart Symbols and Meaning


 Business Intelligence Dashboard
Business Intelligence Dashboard solution extends the ConceptDraw PRO v11 functionality with exclusive tools, numerous ready-to-use vector objects, samples and quick-start templates for creation professional Business Intelligence Dashboards, Business Intelligence Graphics, Business Intelligence Charts and Maps of different kinds. Design easy the BI dashboard, BI model or Dynamic chart in ConceptDraw PRO to monitor the company's work, to track the indicators corresponding your company's data, to display and analyze key performance indicators, to evaluate the trends and regularities of the processes occurring at the company.
 Meter Dashboard
Meter dashboard solution extends ConceptDraw PRO software with templates, samples and vector stencils library with meter indicators for drawing visual dashboards showing quantitative data.
 Sales Dashboard
Sales Dashboard solution extends ConceptDraw PRO software with templates, samples and library of vector stencils for drawing the visual dashboards of sale metrics and key performance indicators (KPI).
Quality visualization in your company

 Sales Flowcharts
The Sales Flowcharts solution lets you create and display sales process maps, sales process workflows, sales steps, the sales process, and anything else involving sales process management.
Reporting & Data Visualization

 ConceptDraw Dashboard for Facebook
ConceptDraw Dashboard for Facebook solution extends ConceptDraw PRO software with a dynamically updated visual dashboard, which shows lifetime total likes, daily friends of fans, and daily page views, information you can receive from Facebook Insights.
- Constant improvement of key performance indicators | TQM Diagram ...
- Performance Indicators | Constant improvement of key performance ...
- Design elements - Status indicators | Status Dashboard | iPhone OS ...
- Key Icon Vector
- Performance Indicators | Dashboard | Logistic Dashboard | Key ...
- Metrics Icon Circle Pi Chart
- Constant improvement of key performance indicators | What is a KPI ...
- Sales Dashboard Meter Gauge Icon
- Performance Indicators | KPI Dashboard | The Facts and KPIs | Key ...
- Glyph icons - Vector stencils library | Computer pictograms - Vector ...
- Performance Indicators | KPI Dashboard | What is a KPI ? | Key ...
- Glyph icons - Vector stencils library | Window elements - Vector ...
- KPI Dashboard | What is a KPI ? | Performance Indicators | Free Kpi ...
- KPI Dashboard | TQM Diagram Example | Business Graphics ...
- Performance Indicators | The Facts and KPIs | KPIs and Metrics ...
- Performance Indicators | PM Dashboards | Design elements - Sales ...
- Constant improvement of key performance indicators | TQM Diagram ...
- Clipart Development Indicator
- Performance Round Icon Orange