Constant improvement of key performance indicators

KPI Dashboard

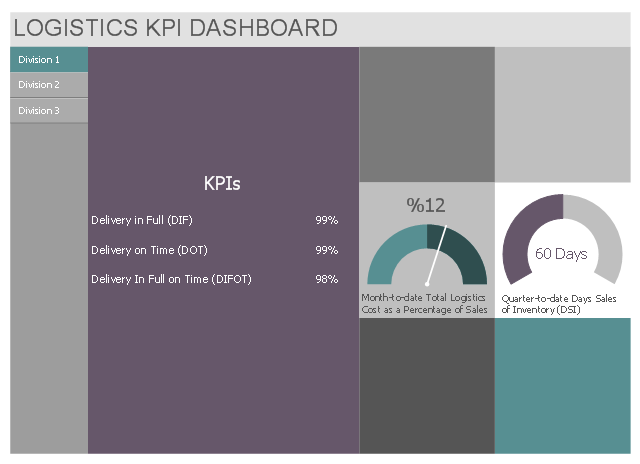
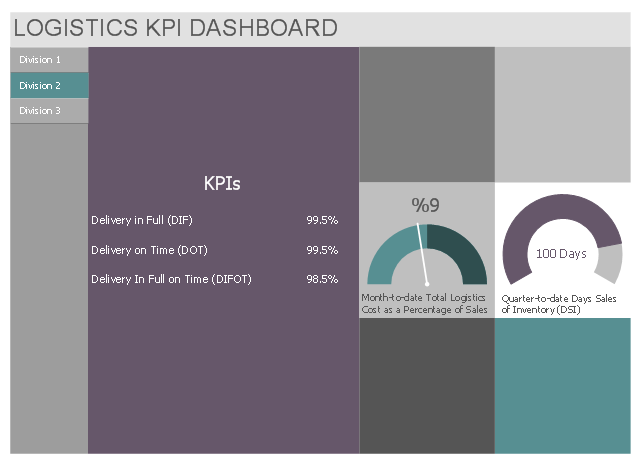
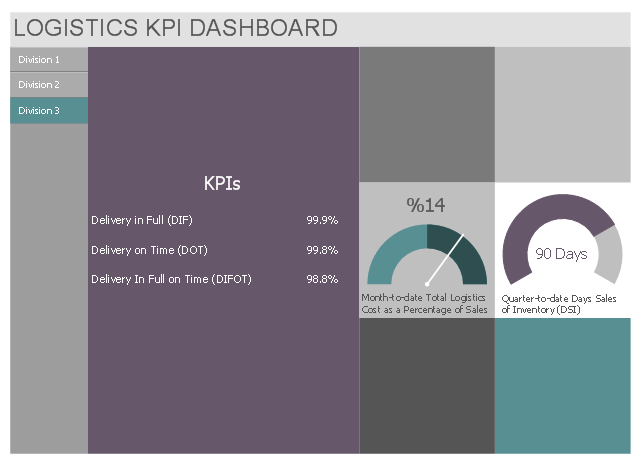
This multipage business dashboard template contains navigation vertical menu and graphic indicators of logistic key performance indicators (KPIs) and business metrics.
Use it to create your logistic KPI dashboard with ConceptDraw PRO software.
The performance dashboard template "Logistics KPI Dashboard" is included in Logistic Dashboard solution from Business Processes area of ConceptDraw Solution Park.
Use it to create your logistic KPI dashboard with ConceptDraw PRO software.
The performance dashboard template "Logistics KPI Dashboard" is included in Logistic Dashboard solution from Business Processes area of ConceptDraw Solution Park.
Division 1
Division 2
Division 3
What is a KPI?

The Facts and KPIs

Performance Indicators

Sales Performance

 Logistic Dashboard
The powerful tools of Logistic Dashboard solution and specially developed live graphic objects of logistic icons, logistic navigation elements, logistic indicators, logistic charts and logistic maps effectively assist in designing Logistic dashboards, Logistic maps, Logistic charts, diagrams and infographics. The included set of prebuilt samples and quick-start templates, demonstrates the power of ConceptDraw PRO software in logistics management, its assisting abilities in development, realization and analyzing the logistic processes, as well as in perfection the methods of logistics management.
A KPI Dashboard Provides the Answers Your Sales Team

Quality Mind Maps - samples and templates

The vector stencils library "Sales KPIs and Metrics" contains 15 chart templates and graphic indicators of sales key performance indicators (KPIs) and metrics.
Use it for drawing sales dashboards in the ConceptDraw PRO diagramming and vector drawing software extended with the Sales Dashboard solution from the Marketing area of ConceptDraw Solution Park.
Use it for drawing sales dashboards in the ConceptDraw PRO diagramming and vector drawing software extended with the Sales Dashboard solution from the Marketing area of ConceptDraw Solution Park.
Actual vs Plan

Average Purchase Value

Clicks from Sales Follow-Up Emails

Cost per customer

Cost per order

Lead Response Time

Opportunity-to-Win Ratio

Product mix

Product Performance

Rate of Contact

Rate of Follow Up Contact

Sales Growth

Sales Target

Social Media Usage

Usage Rate of Marketing Collateral

Dashboard

What is a Quality Management

PROBLEM ANALYSIS. Relations Diagram


HelpDesk
How To Create the Interaction (Relation) Diagram
 Diagram sample")
- The Facts and KPIs | KPIs and Metrics | Performance Indicators ...
- Free Kpi Template Excel
- Key Performance Indicator Template
- KPI Dashboard | Sales Dashboard | Performance Indicators | Key ...
- Sales KPIs and Metrics - Vector stencils library | Design elements ...
- Constant improvement of key performance indicators | Quality Mind ...
- Key Performance Indicator Excel Template
- Template Powerpoint Kpi
- Performance Indicators | Dashboard | Logistic Dashboard | Key ...
- KPIs and Metrics | Visualize Sales Data Using Sample Data | Sales ...
- Constant improvement of key performance indicators | Total Quality ...
- Performance dashboard
- Sample Of Kpi Template
- Time series digital dashboard - Template | Performance Indicators ...
- Performance Indicators | KPI Dashboard | What is a KPI ? | Key ...
- Sales Dashboard Template | KPI Dashboard | KPIs and Metrics | Ppt ...
- Hr Metrics Dashboard Example
- Sales Dashboard Template | Performance Indicators | Sales Teams ...
- Sales Dashboard | Dashboard | KPI Dashboard | Dashboard ...