This site uses cookies. By continuing to browse the ConceptDraw site you are agreeing to our Use of Site Cookies.
HelpDesk

How to Use ConceptDraw Dashboard for Facebook on PC

The ConceptDraw Dashboard for Facebook Solution is a visual dashboard that visualizes lifetime total Likes, daily Friends of Fans, and daily Page views based on the information exported from your Facebook Page.
HelpDesk

How to Create a Meter Dashboard

ConceptDraw Meter Dashboard solution is design to support creating interactive indicator such as Gauges, Meters, Bullets and Sliders. It is based on a Live Object technology. Live Meters indicators are used to show various types of quantitative data, and can be arranged into a dashboard. The dashboard displays the actual data from the data source files with regular updates every 5 seconds.

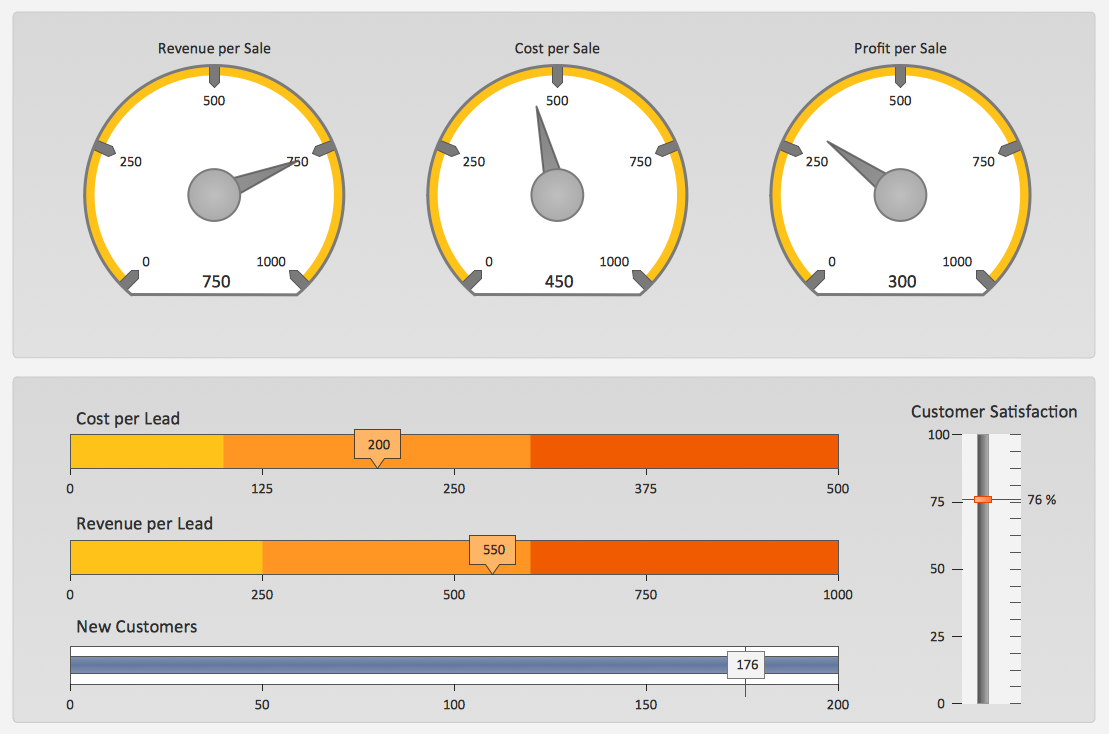
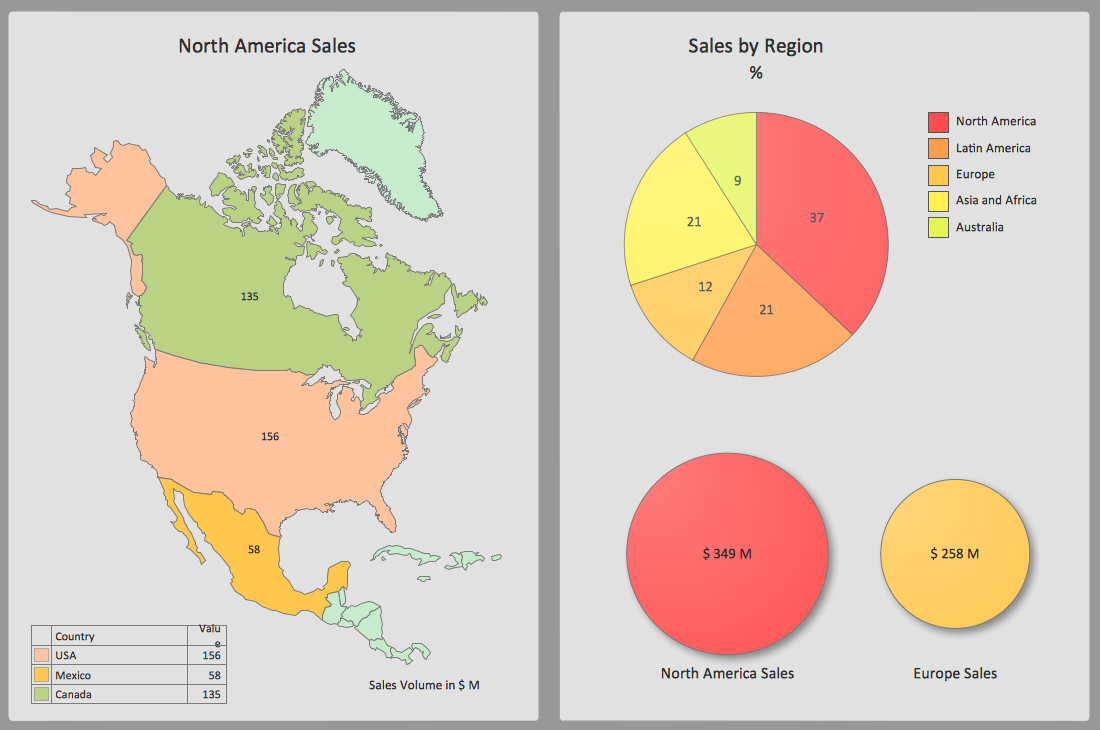
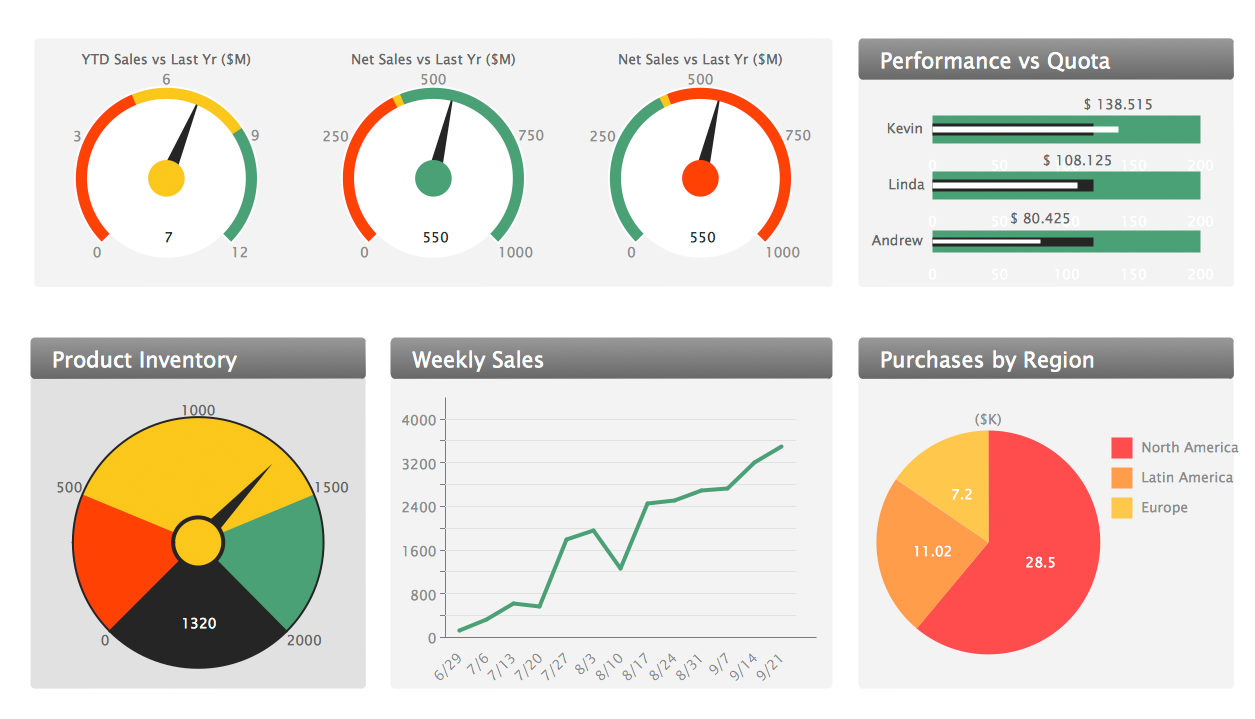
Sales Dashboard Template

ConceptDraw DIAGRAM software extended with the Sales Dashboard solution delivers a complete set of samples, templates and pre-designed objects you need for visualizing sales data.
HelpDesk

How To Create a CRM System Dashboard

Succeed in drawing the CRM Dashboards and CRM Center Dashboards depicting current and actual companies information and data with ConceptDraw DIAGRAM CRM software supplied with CRM Center Dashboard solution.
HelpDesk

How To Create Visio Bubble Chart

ConceptDraw DIAGRAM allows you to easily create business charts and diagrams of any complexity, including the bubbles diagram and then make an MS Visio file from your diagram in a few simple steps.

Amazon Web Services, AWS, Amazon cloud AWS Architecture Diagrams

Amazon Web Services, AWS, Amazon cloud
AWS Architecture Diagrams with powerful drawing tools and numerous predesigned Amazon icons and AWS simple icons is the best for creation the AWS Architecture Diagrams, describing the use of Amazon Web Services or Amazon Cloud Services, their application for development and implementation the systems running on the AWS infrastructure. The multifarious samples give you the good understanding of AWS platform, its structure, services, resources and features, wide opportunities, advantages and benefits from their use; solution’s templates are essential and helpful when designing, description and implementing the AWS infrastructure-based systems. Use them in technical documentation, advertising and marketing materials, in specifications, presentation slides, whitepapers, datasheets, posters, etc.

Sales Dashboard Examples

Visualizing sales data you may need a good example to start. ConceptDraw Sales Dashboard solution delivers a complete set of templates and samples you can use as examples to start composing your own sales dashboard.
HelpDesk

How To Create an HR Metric Dashboard

Human Resources dashboards can be used for analyzing hr workflow in an organization and identifying points for improvement. They are useful to HR managers, and for C level executives. HR dashboard helps to monitor HR KPIs. Thus Decision makers will ensure that company strategy is aligned from an executive, to managerial, to individual goals. HR Dashboard Solution for ConceptDraw DIAGRAM allows you to see what information you need from each KPI to see if your Human Resources management performs accurate and cost-efficient.

Sales Dashboard

Sales Dashboard is a useful and visual way of representing sales performances, tracking and analyzing sales. It gives a clear picture about the business development success and sales growth progress.
ConceptDraw DIAGRAM software extended with Sales Dashboard solution from the Marketing area of ConceptDraw Solution Park is effective for visualizing sales data, all set of KPIs on the Sales Dashboard with purpose to see how your business develops and to make conclusions for improvement the sales.