 Healthcare Management Workflow Diagrams
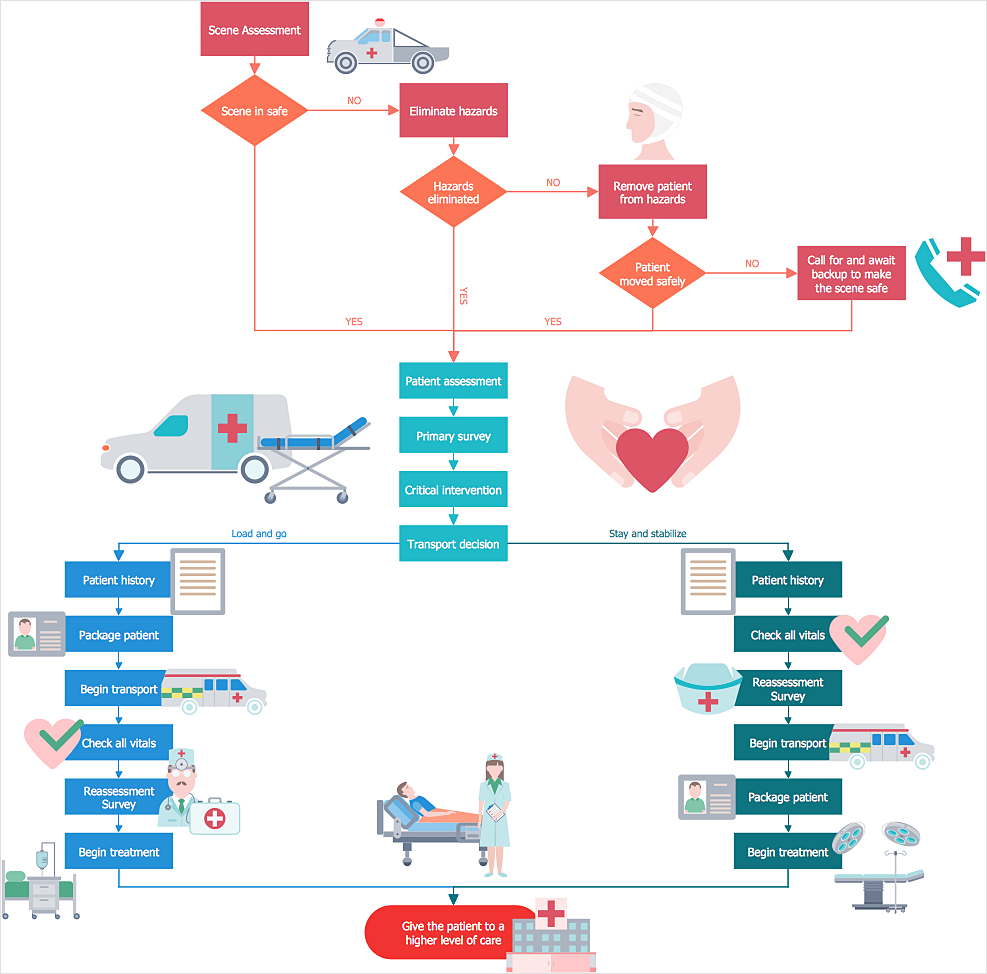
Healthcare Management Workflow Diagrams solution contains large set of colorful samples and libraries with predesigned vector pictograms and symbols of health, healthcare equipment, medical instruments, pharmaceutical tools, transport, medication, departments of healthcare organizations, the medical icons of people and human anatomy, as well as the predesigned flowchart objects, connectors and arrows, which make it the best for designing clear and comprehensive Medi?al Workflow Diagrams and Block Diagrams, Healthcare Management Flowcharts and Infographics, Healthcare Workflow Diagram, for depicting the healthcare workflow and clinical workflows in healthcare, for making the workflow analysis healthcare and healthcare workflow management.
 Total Quality Management TQM Diagrams
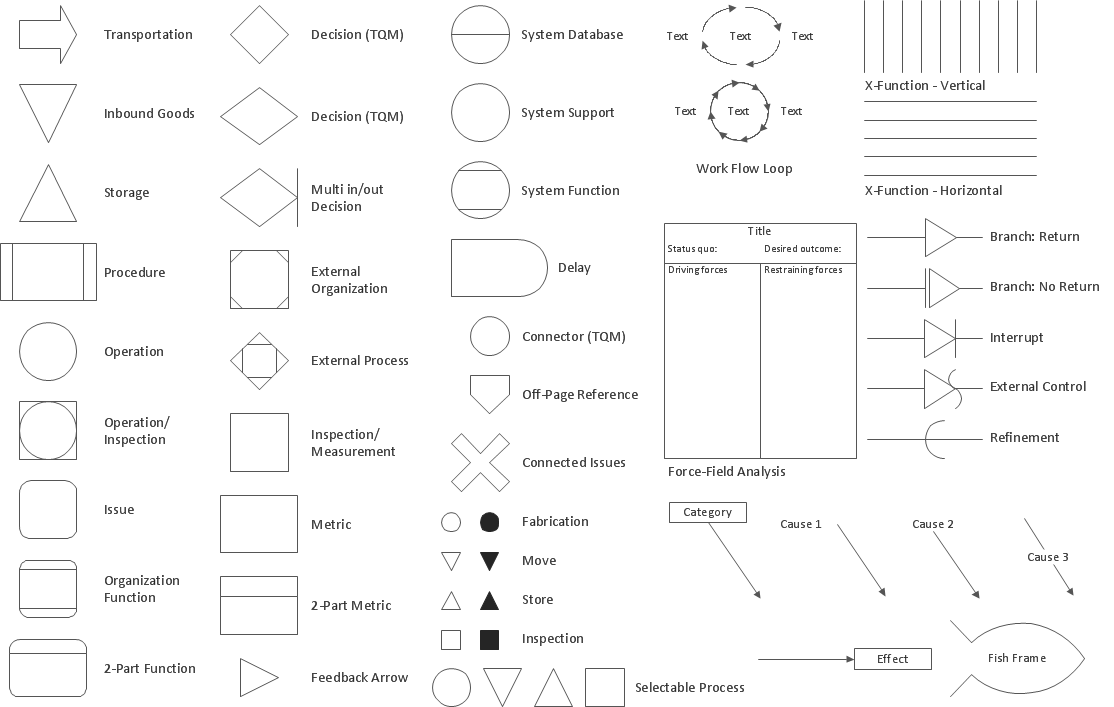
Total Quality Management Diagrams solution extends ConceptDraw DIAGRAM software with samples, templates and vector stencils library for drawing the TQM flowcharts.
 Fishbone Diagrams
The Fishbone Diagrams solution extends ConceptDraw DIAGRAM software with the ability to easily draw the Fishbone Diagrams (Ishikawa Diagrams) to clearly see the cause and effect analysis and also problem solving. The vector graphic diagrams produced using this solution can be used in whitepapers, presentations, datasheets, posters, and published technical material.
Pyramid Diagram
The Project Management Triangle Diagram depicts three main constraints of any project: scope, time and cost. Projects have to comply with the specified scope, projects should be finished in time and projects need to consume the budget. Each of the constraints represents one side of the triangle, and any change in budget or timing or scope affects the entire diagram. This diagram was made using ConceptDraw Office suite including best marketing project management software extended with collection of tools for creative project management software and project management reporting software symbols.Network Diagrams for Bandwidth Management
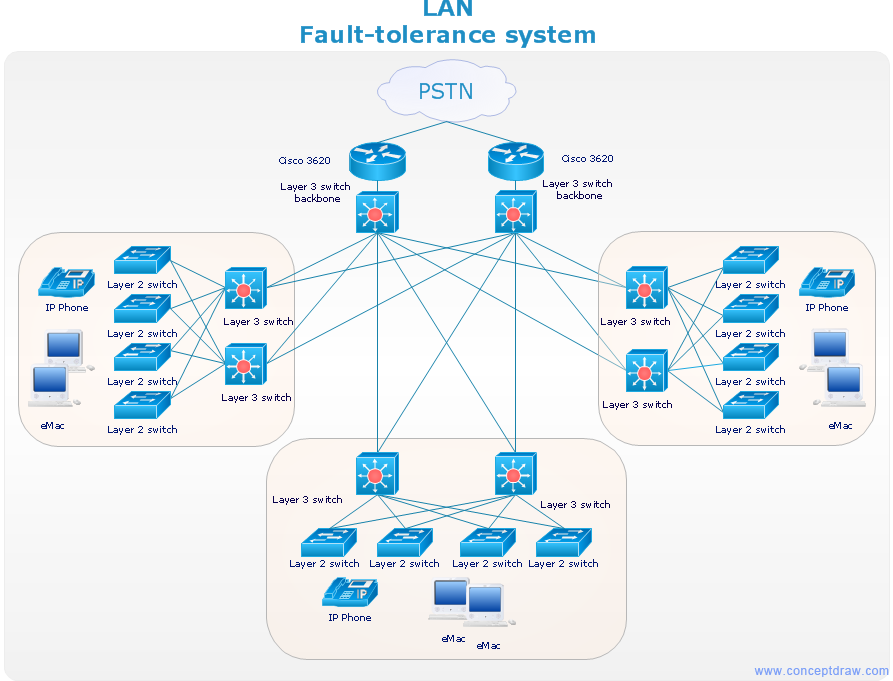
A perfect tool to draw network diagram for bandwidth management. Computer & Networks solution provides the symbol libraries with pre-designed network graphic elements. Use Computer & Networks solution to draw the network diagrams for bandwidth management for Cisco networks, Apple networks, IVR networks, GPRS networks, wi-fi networks, LAN and WAN.
Bar Diagrams for Problem Solving. Create business management bar charts with Bar Graphs Solution
Create bar charts for business management problem solving and data comparison using the ConceptDraw DIAGRAM diagramming and vector drawing software extended with the Bar Graphs Solution from the Graphs and Charts area of ConceptDraw Solition Park.Problem solving
Problem Solving - ConceptDraw Office suite is a software for the problem solving. The Seven Management and Planning Tools solution is a set of such tools for investigating complex problems. These tools are exemplary at organizing research, parsing complex problems, providing a structure for the details, helping managers make decisions, and organizing effective communications in a visual manner that keeps everyone involved.
Organizational Structure Total Quality Management
The Total Quality Management Diagram solution helps you and your organization visualize business and industrial processes. Create Total Quality Management diagrams for business process with ConceptDraw software.TQM Diagram Tool
The Total Quality Management Diagram solution helps you and your organization visualize business and industrial processes. Create Total Quality Management diagrams for business process with ConceptDraw software.Business Process Management
ConceptDraw RapidDraw technology is a simple point-and-click design that helps create professional, presentation-ready business process diagrams quickly and efficiently.Total Quality Management Business Diagram
The Total Quality Management Diagram solution helps you and your organization visualize business and industrial processes. Create Total Quality Management diagrams for business process with ConceptDraw software.Management Tools — Total Quality Management
The Total Quality Management Diagram solution helps your organization visualize business and industrial processes. Create Total Quality Management diagrams for business process with ConceptDraw software.HelpDesk
How to Create a Healthcare Management Workflow Diagram
The health and medical workflow diagrams are widespread in medicine to depict the sequence of actions of the medical workers to eliminate particular health problems of the patient. Also drawing is the best way to illustrate processes occurring in the human body. Healthcare Management Workflow Diagrams for ConceptDraw DIAGRAM provides the large set of colorful samples and libraries with predesigned vector pictograms and symbols of health, healthcare equipment, medical instruments, pharmaceutical tools, transport, medication, etc. The Healthcare Management Workflow Diagrams solution found in the Business Processes section of ConceptDraw Solution Park is the best choice for designing clear and comprehensive Medical Workflow Diagrams, Healthcare Management Flowcharts and Infographics.Social Media Response Management DFD Charts - software tools
ConceptDraw is your tool for driving social integration and managing change across and streamline social media processes of your organisation.This tool keeps the entire team on the same page allowing you to realize your social media strategy, improve the quality of your answers, and minimize the time it takes to respond.
Bar Diagrams for Problem Solving. Create event management bar charts with Bar Graphs Solution
Create bar charts for event management problem solving and visual data comparison using the ConceptDraw DIAGRAM diagramming and vector drawing software extended with the Bar Graphs Solution from the Graphs and Charts area of ConceptDraw Solition Park.TQM Diagram — Professional Total Quality Management
The Total Quality Management Diagram solution helps you and your organization visualize business and industrial processes. Create Total Quality Management diagrams for business process with ConceptDraw software.TQM Software — Build Professional TQM Diagrams
The Total Quality Management Diagram solution helps you and your organization visualize business and industrial processes. Create Total Quality Management diagrams for business process with ConceptDraw software.
 Business Diagrams Package
Business Diagrams Package is a large set of comprehensive graphical solutions from the ConceptDraw Solution Park, which are powerful in solving the business, marketing and quality tasks in completely different fields, such as finance, education, health food and cooking, HR, and many others. The tools of this package's solutions are a powerful assistant in drawing all diversity of Financial and Marketing infographics, Business process workflow diagrams, Organizational charts, Education infographics, Quality diagrams, Health food diagrams, HR flowcharts, as well as different graphics and charts, which depict the values of key business indicators, their dependencies, give the full understanding of a situation within a company and on the market.
The Fifty Two Elements of TQM
The Total Quality Management Diagram solution helps your organization visualize business and industrial processes. Create Total Quality Management diagrams for business process with ConceptDraw software.Using Fishbone Diagrams for Problem Solving
Problems are obstacles and challenges that one should overcome to reach the goal. They are an inseparable part of any business, and the success of an enterprise often depends on ability to solve all problems effectively. The process of problem solving often uses rational approach, helping to find a suitable solution. Using Fishbone Diagrams for Problem Solving is a productive and illustrative tool to identify the most important factors causing the trouble. ConceptDraw DIAGRAM extended with Fishbone Diagrams solution from the Management area of ConceptDraw Solution Park is a powerful tool for problem solving with Fishbone Ishikawa diagram graphic method.- Chart Of Management Information System With Diagram
- With The Aid Of Diagram Explain Management Information System
- Block Diagram Of Management Accounting And Financial Accounting
- Pyramid Diagram | 4 Level pyramid model diagram - Information ...
- Quality Management System | Process Flowchart | Identifying Quality ...
- Project Management Venn Diagram
- Total Quality Management with ConceptDraw | Fishbone Diagrams ...
- Total Quality Management Definition | Process Flowchart | Block ...
- Management Diagrams
- Activity Diagram For School Management System Pdf
- Process Flowchart | TQM Diagram Example | Definition TQM ...
- Fishbone Diagram Problem Solving | Human Resource ...
- Draw A Schematic Diagram Of Management In An Organisation
- Dfd Diagram Of Online Library Management System
- Block Diagram Of Software Project Management
- Time Management Pie Chart Activity
- Venn Diagrams | Accounting Flowcharts | Diagram Of Management ...
- Draw Package Diagram For Students Management System
- Definition TQM Diagram | TQM Diagram Example | Organizational ...
- Data Flow Diagram Company Management System


