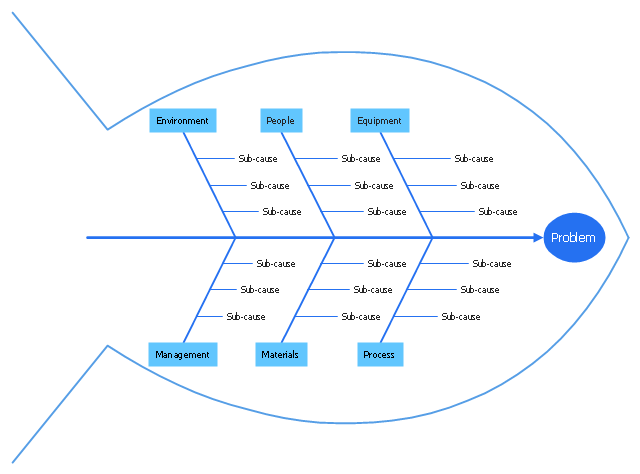
"Common uses of the Ishikawa diagram are product design and quality defect prevention, to identify potential factors causing an overall effect. Each cause or reason for imperfection is a source of variation. Causes are usually grouped into major categories to identify these sources of variation. The categories typically include:
(1) People: Anyone involved with the process;
(2) Methods: How the process is performed and the specific requirements for doing it, such as policies, procedures, rules, regulations and laws;
(3) Machines: Any equipment, computers, tools, etc. required to accomplish the job;
(4) Materials: Raw materials, parts, pens, paper, etc. used to produce the final product;
(5) Measurements: Data generated from the process that are used to evaluate its quality;
(6) Environment: The conditions, such as location, time, temperature, and culture in which the process operates. ...
Ishikawa diagrams were popularized by Kaoru Ishikawa in the 1960s, who pioneered quality management processes in the Kawasaki shipyards, and in the process became one of the founding fathers of modern management.
The basic concept was first used in the 1920s, and is considered one of the seven basic tools of quality control." [Ishikawa diagram. Wikipedia]
This quality Ishikawa diagram (cause and effect diagram) template is included in the Fishbone Diagram solution from the Management area of ConceptDraw Solution Park.
Quality fishbone diagram
Cause and Effect Diagrams

ConceptDraw PRO powerful diagramming and vector drawing software provides the Fishbone Diagrams solution from the Management area of ConceptDraw Solution Park that allows to design the Cause and Effect Diagrams quick, easy and effective.
 Seven Management and Planning Tools
Seven Management and Planning Tools solution extends ConceptDraw PRO and ConceptDraw MINDMAP with features, templates, samples and libraries of vector stencils for drawing management mind maps and diagrams.
TQM Diagram Tool

House of Quality Matrix Software

TQM Diagram Example

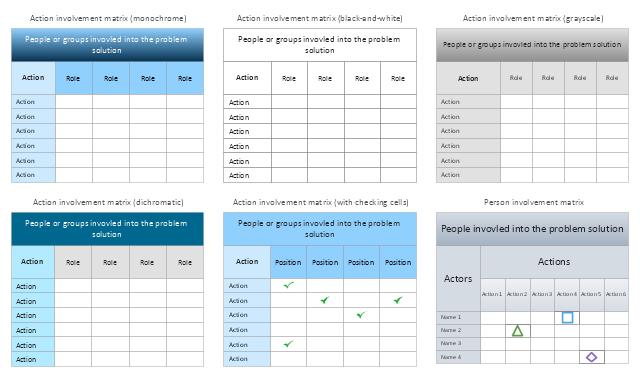
The vector stencils library Involvement matrix contains 20 templates and symbols for drawing the involvement matrices using the ConceptDraw PRO diagramming and vector drawing software. The involvement matrix is one of the Seven Management and Planning Tools (7 MP tools, Seven New Quality Tools).
"Matrix Diagram ... shows the relationship between items. At each intersection a relationship is either absent or present. It then gives information about the relationship, such as its strength, the roles played by various individuals or measurements. Six differently shaped matrices are possible: L, T, Y, X, C, R and roof-shaped, depending on how many groups must be compared." [Seven Management and Planning Tools. Wikipedia]
Use it to show what people and groups are involved in actions, and what their role is in every action.
The example "Design elements - Involvement matrix" is included in the solution "Seven Management and Planning Tools" from the Management area of ConceptDraw Solution Park.
Involvement matrices
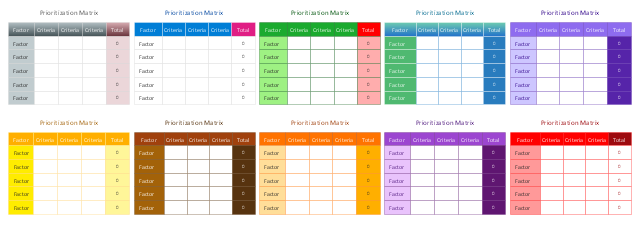
This vector stencils library contains 10 templates for drawing the prioritization matrices using the ConceptDraw PRO diagramming and vector drawing software.
The prioritization matrix is one of the Seven Management and Planning Tools (7 MP tools, Seven New Quality Tools).
"Prioritization Matrix ... is used to prioritize items and describe them in terms of weighted criteria. It uses a combination of tree and matrix diagramming techniques to do a pair-wise evaluation of items and to narrow down options to the most desired or most effective. Popular applications for the Prioritization Matrix include Return-on-Investment (ROI) or Cost-Benefit analysis (Investment vs. Return), Time management Matrix (Urgency vs. Importance), etc." [Seven Management and Planning Tools. Wikipedia]
Use prioritization matrix to rank items based on a set of criteria.
The example "Design elements - Prioritization matrix" is included in the solution "Seven Management and Planning Tools" from the Management area of ConceptDraw Solution Park.
Prioritization matrices
TQM Software — Build Professional TQM Diagrams

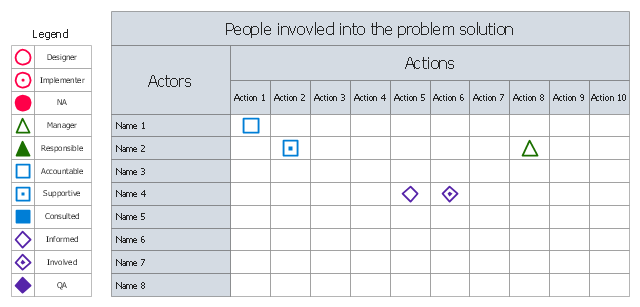
The involvement matrix (responsibility assignment matrix, RAM, RACI matrix, ARCI matrix, linear responsibility chart, LRC) defines the level of involvement and nature of participation . The diagram shows the degree of involvement for all identified parties in the execution of corrective actions.
"Key responsibility roles.
Responsible.
Those who do the work to achieve the task. There is at least one role with a participation type of responsible, although others can be delegated to assist in the work required (see also RASCI below for separately identifying those who participate in a supporting role).
Accountable (also approver or final approving authority).
The one ultimately answerable for the correct and thorough completion of the deliverable or task, and the one who delegates the work to those responsible. In other words, an accountable must sign off (approve) on work that responsible provides. There must be only one accountable specified for each task or deliverable.
Consulted (sometimes counsel).
Those whose opinions are sought, typically subject matter experts; and with whom there is two-way communication.
Informed.
Those who are kept up-to-date on progress, often only on completion of the task or deliverable; and with whom there is just one-way communication." [Responsibility assignment matrix. Wikipedia]
The involvement matrix is one of the Seven Management and Planning Tools (7 MP tools, Seven New Quality Tools).
The person involvement matrix template for the ConceptDraw PRO diagramming and vector drawing software is included in the solution "Seven Management and Planning Tools" from the Management area of ConceptDraw Solution Park.
Person involvement matrix
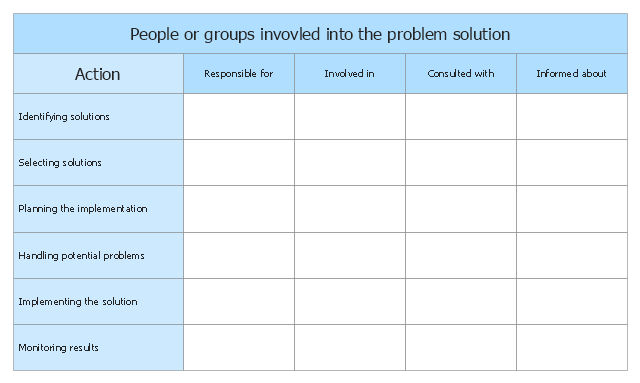
The involvement matrix defines the level of involvement and nature of participation . The diagram shows the degree of involvement for all identified parties in the execution of corrective actions.
The involvement matrix is one of the Seven Management and Planning Tools (7 MP tools, Seven New Quality Tools).
The action involvement matrix template for the ConceptDraw PRO diagramming and vector drawing software is included in the solution "Seven Management and Planning Tools" from the Management area of ConceptDraw Solution Park.
Involvement matrix
The PERT chart shows the logical connections and consequence of a set of tasks. PERT charts the time period for problem solving and the implementation plan for all activities along the critical path. The PERT chart is also known as a precedence diagram or project network diagram.
"The Program (or Project) Evaluation and Review Technique, commonly abbreviated PERT, is a statistical tool, used in project management, that is designed to analyze and represent the tasks involved in completing a given project. ...
PERT is a method to analyze the involved tasks in completing a given project, especially the time needed to complete each task, and to identify the minimum time needed to complete the total project.
PERT was developed primarily to simplify the planning and scheduling of large and complex projects. ...
A network diagram can be created by hand or by using diagram software. There are two types of network diagrams, activity on arrow (AOA) and activity on node (AON). Activity on node diagrams are generally easier to create and interpret." [Program Evaluation and Review Technique. Wikipedia]
The PERT chart is one of the Seven Management and Planning Tools (7 MP tools, Seven New Quality Tools).
The PERT chart template for the ConceptDraw PRO diagramming and vector drawing software is included in the solution "Seven Management and Planning Tools" from the Management area of ConceptDraw Solution Park.
PERT chart template

Legend

 Basic Diagramming
This solution extends ConceptDraw PRO software with the specific tools you need to easily draw flowcharts, block diagrams, histograms, pie charts, divided bar diagrams, line graphs, circular arrows diagrams, Venn diagrams, bubble diagrams and concept maps
TQM Diagram — Professional Total Quality Management

HelpDesk
How to Create a TQM Diagram Using Total Quality Management Solution

 Quality
This solution extends ConceptDraw PRO v9 and ConceptDraw MINDMAP v7 with Quality Management Diagrams (Total Quality Management Diagrams, Timelines, Workflows, Value Stream Maps) and Mind Maps (Presentations, Meeting Agendas, Problem to be solved).
 ConceptDraw Solution Park
ConceptDraw Solution Park collects graphic extensions, examples and learning materials
 Fishbone Diagram
Fishbone Diagrams solution extends ConceptDraw PRO software with templates, samples and library of vector stencils for drawing the Ishikawa diagrams for cause and effect analysis.
- Seven Management and Planning Tools | TQM Diagram Tool ...
- Probability Quality Control Tools
- Total Quality Management Value
- Basic Flowchart Symbols | Best Flowchart Software | Flowchart ...
- Basic Workflow Examples | Design elements - Fishbone diagram ...
- Design elements - Fishbone diagram | Probability Quality Control ...
- Total Quality Management with ConceptDraw | TQM Diagram Tool ...
- Pareto Chart | Total Quality Management with ConceptDraw | Bar ...
- Fishbone Diagram | Design elements - Fishbone diagram ...
- Design elements - Fishbone diagram | Fishbone diagram - Causes ...
- Fishbone Diagram | Business Productivity Diagramming ...
- Process Flowchart | Business diagrams & Org Charts with ...
- Fishbone diagram - Causes of low- quality output
- Fishbone Diagram | Design elements - Fishbone diagram | Business ...
- Ishikawa diagram - Factors reducing competitiveness | Business ...
- Cause & Effect Analysis | Fishbone Diagram Software for Design ...
- Fishbone Diagram | Quality fishbone diagram template | Fishbone ...
- Fishbone Diagram | Fishbone diagram - Causes of low- quality ...
- Cause and Effect Analysis (Fishbone Diagrams) | Using Fishbone ...
- Fishbone Diagram | Fishbone Diagram Software for Design ...